Top of page
Analytics

Turn Data Into Better Decisions

As the saying goes, data is only as valuable as the content and goals behind it. Before using analytics to evaluate your website’s performance, it’s important to understand what you want your site to accomplish and what actions you want users to take once they arrive.

With those goals in mind, let’s explore a few key metrics from Siteimprove’s Analytics module that can help you regularly evaluate your website’s performance. This isn’t an exhaustive list of every metric and tool available, but these are some of the most useful to incorporate into your ongoing analysis.

Using Analytics to Measure Website Success

If you’re new to analytics or just want to feel more confident interpreting your data, this presentation will help you understand key metrics and how to use them to evaluate your website’s performance and goals.

Data we can all use.

If you currently use—or have previously used—a web analytics platform such as Google Analytics 4 (GA4), you know how valuable website data can be. However, platforms like GA4 can sometimes make it difficult to find the specific information you need, and the data itself may be challenging to interpret, particularly for those without specialized analytics or SEO experience.

Siteimprove’s Analytics module takes a different approach. It organizes meaningful metrics in intuitive locations and presents them in accessible terms, making valuable insights easier to find and understand—whether you’re new to analytics or an experienced data professional.

The features most relevant to Wake Forest website and content editors—and the ones used most frequently—are provided below.

Content

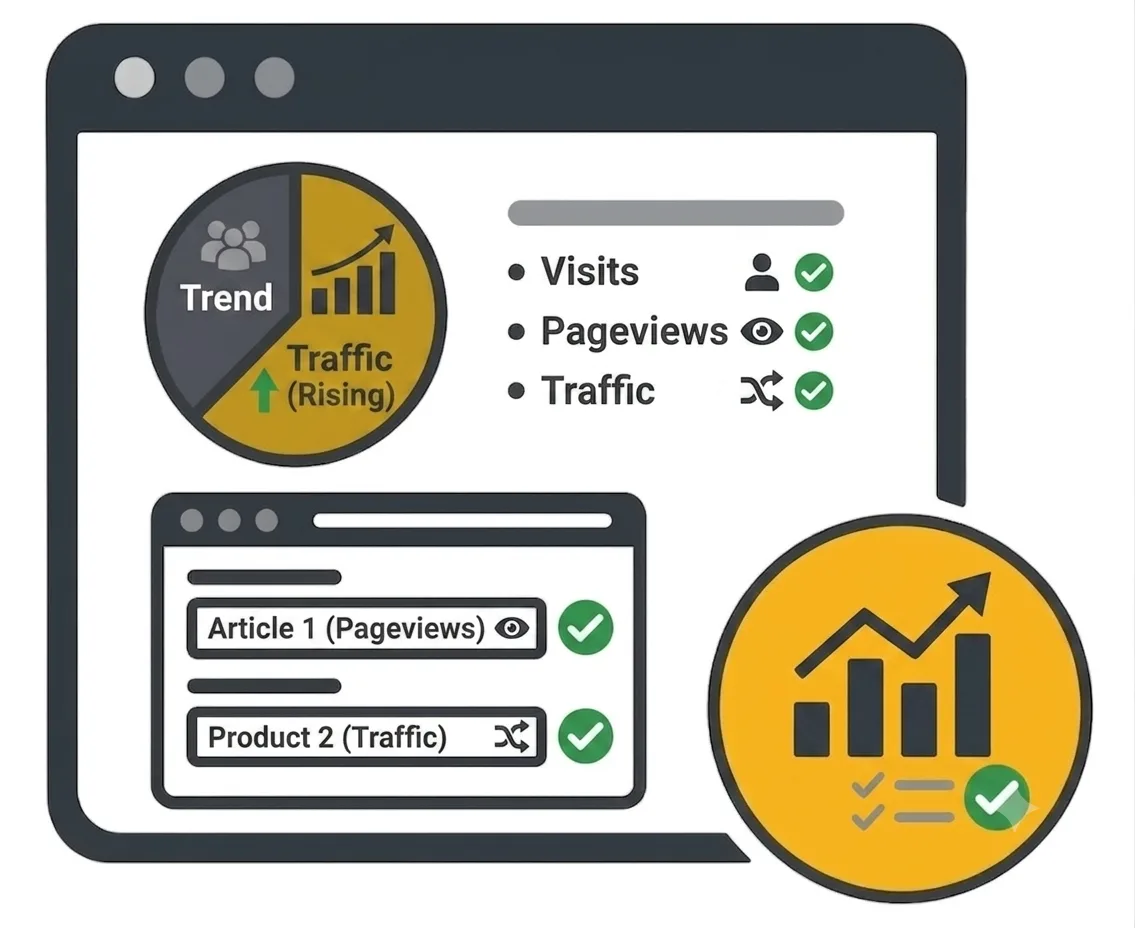
Since web analytics first became available, metrics such as pageviews, visits, and unique visitors have helped professionals measure audience interest and make informed content decisions.

Today, the rise of GenAI and evolving SEO practices means these metrics no longer tell the whole story of how users discover and engage with content. However, they remain valuable indicators of content performance—and in this tutorial, we’ll explore how to use them effectively.
Content features within web analytics icon

Visitors

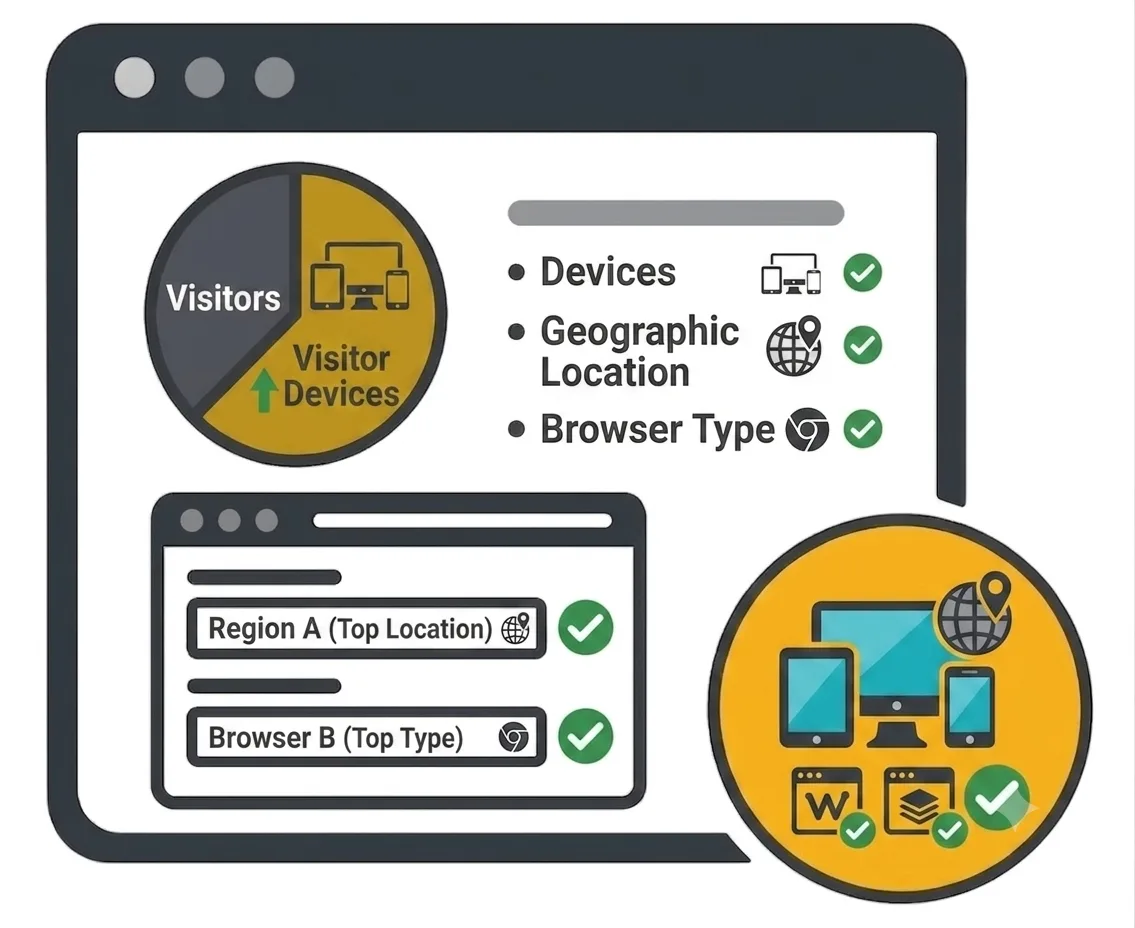
Understanding how your audience accesses your site—and how your content appears across different devices—is an important part of ensuring your website provides a consistent experience for all users.

In this tutorial, we’ll focus on device type, but other metrics can also provide valuable insights into your audience and how they experience your site, including their country of origin, web browser, and screen resolution.

Visitor features within web analytics icon

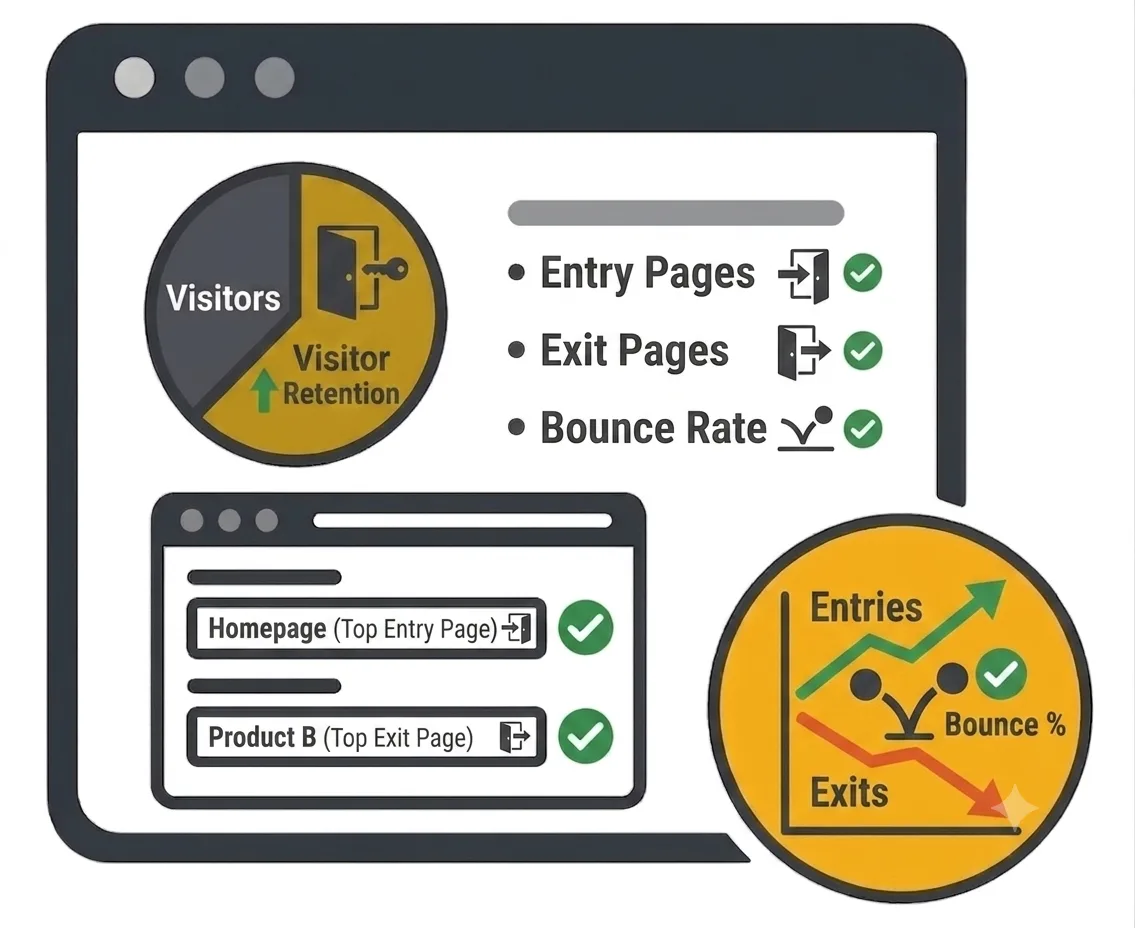
Entries & Exits

An entry page is the first page a user visits when arriving at your site, while an exit page is the last page they view before leaving. Understanding where users begin and end their journeys can provide valuable insights into how your content is performing and inform your overall content strategy.

In this tutorial, we’ll show you where to find entry and exit page data, as well as explain outbound links and bounce rates.

Entries and exits feature within web analytics icon

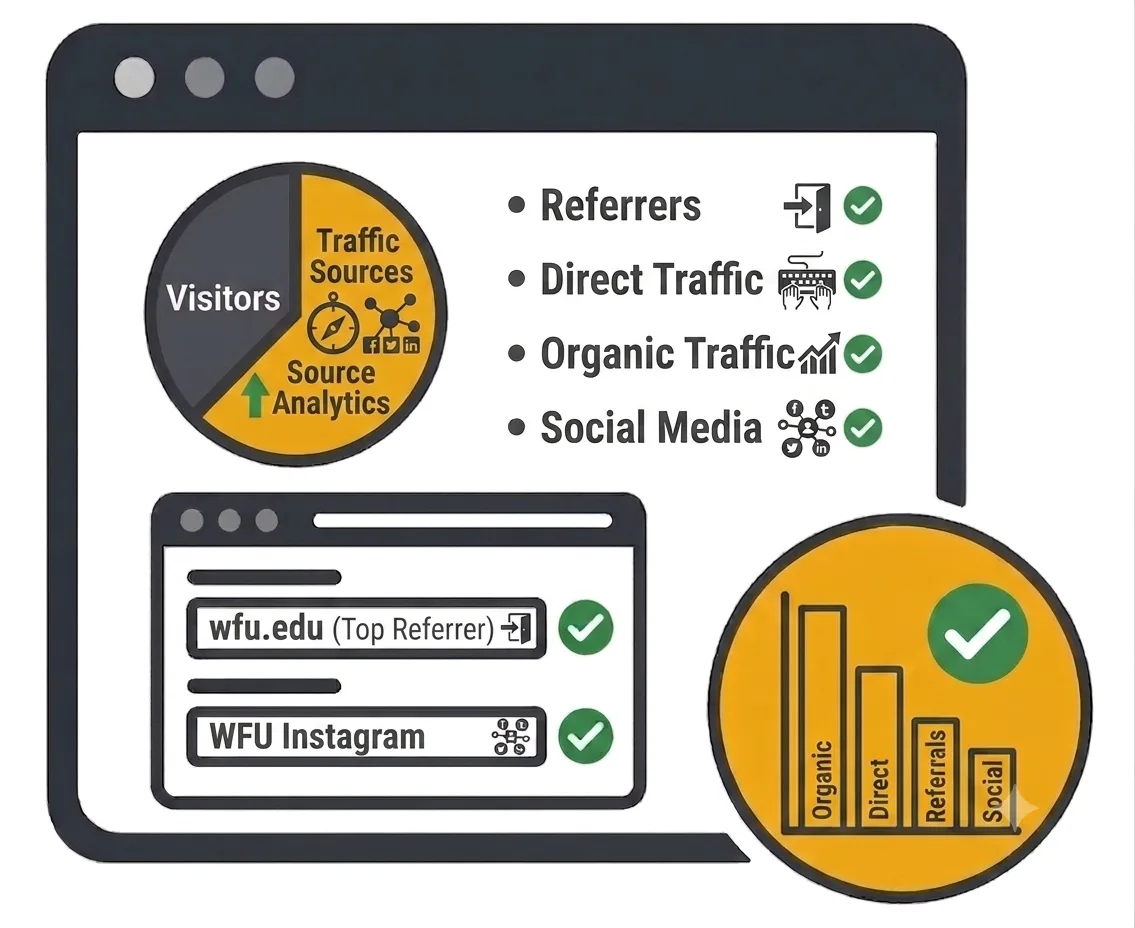
Traffic Sources

Have you ever wondered how visitors find your website? Did they arrive through a link on a search engine results page, click a link in an email you sent, or come from an AI-powered tool?

In this tutorial, we’ll explore the different types of traffic sources, explain what each term means, and discuss why understanding them is important for your content strategy.

Traffic sources icon

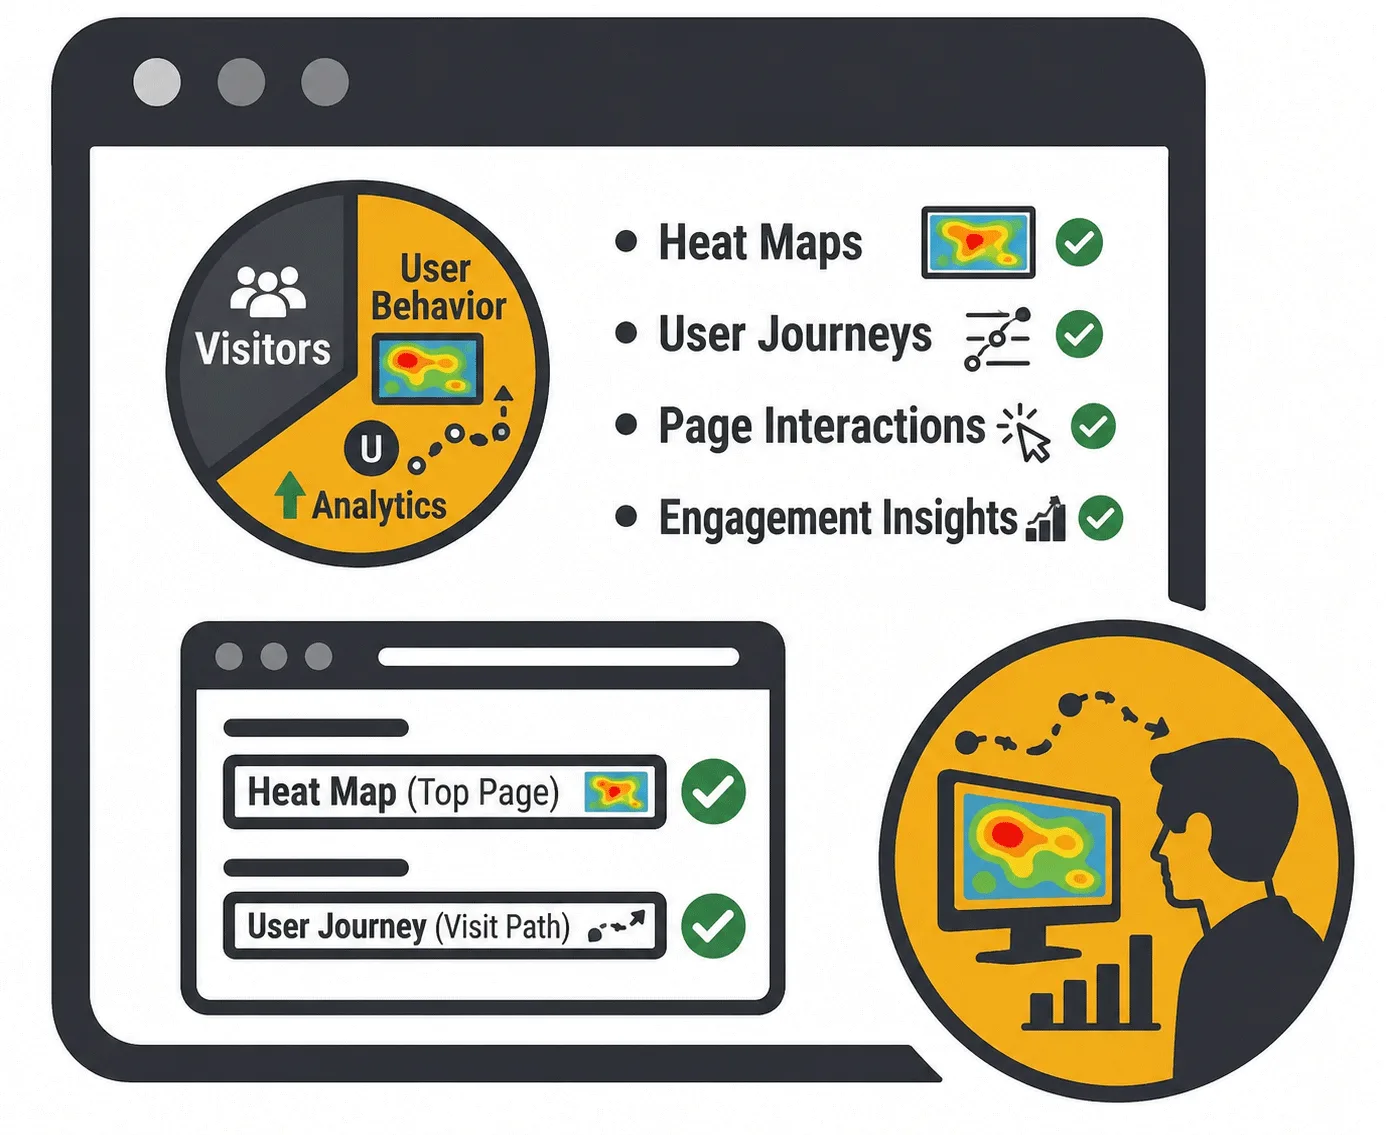
Behavior

Siteimprove’s Behavior module provides insights into how users interact with your site—from the journeys they take and the links they click to how far they scroll down a page.

In this tutorial, we’ll explore features such as User Journeys, Behavior Maps, Visit Length and Time, and Event Tracking, and explain how each can help you better understand user behavior.

User Behavior icon
Quality Assurance Icon

Whether you’re planning to attend an upcoming digital strategy presentation or want to revisit a previous session, explore the topics we cover and resources we share.