
Analytics
Measuring Your Website’s Performance
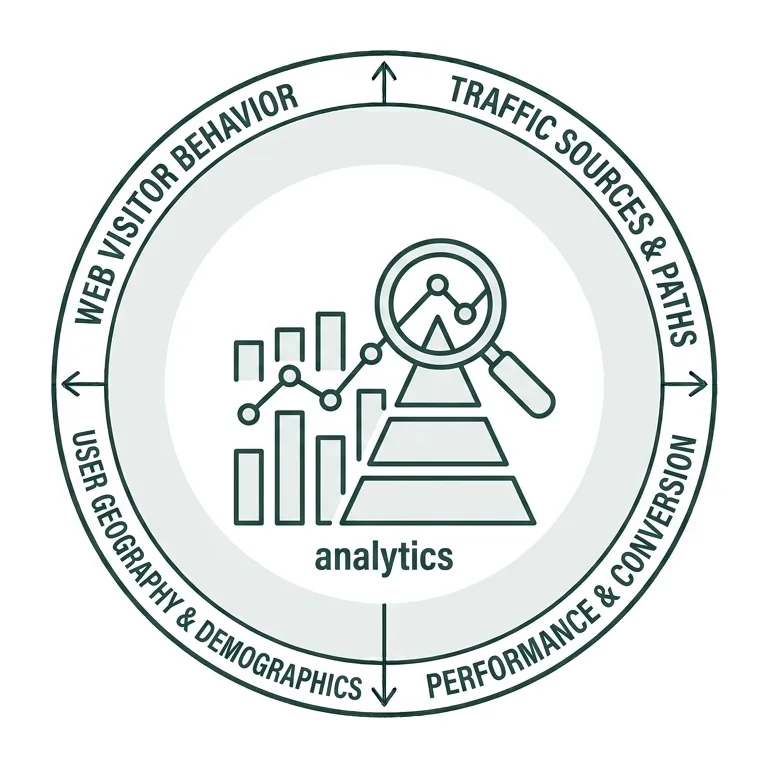
Traditional analytics platforms, such as Google Analytics and Siteimprove Analytics, provide valuable insights into website visitors and performance. They help you understand which pages get the most traffic, where visitors come from, and which content resonates most with your audience.
In this section, we’ll look at key metrics and why they matter. While analytics offer a strong foundation for understanding performance, they don’t tell the full story. They can’t fully explain user behavior or capture all the ways people discover content today, including through AI-powered search. Even so, analytics remain an essential starting point for measuring success and identifying opportunities to improve.
Key Analytics Metrics
Using Analytics to Measure Website Success
If you’re new to analytics or just want to feel more confident interpreting your data, this presentation will help you understand key metrics and how to use them to evaluate your website’s performance and goals.
Analytics should be a guide, not the rule.
Website analytics turn user data into actionable insights that help you make informed decisions instead of relying on assumptions. They reveal how visitors use your site, identify areas for improvement, measure the impact of your efforts, and help prioritize changes that support your website’s goals.
Many of you may already be familiar with Google Analytics (GA4), which has long been the standard for measuring website performance. In recent years, however, several new analytics platforms have emerged, each offering its own set of tools and insights. At Wake Forest, Siteimprove’s Analytics module is the primary platform recommended for web editors to monitor and evaluate website performance.
Your analytics are only as meaningful as your understanding of your content’s goals.
Whether you use Google Analytics or Siteimprove, the underlying principle remains the same: analytics should inform your decisions, not dictate them. Metrics provide valuable insight into how your content is performing, but they tell only part of the story.
The rise of generative AI has fundamentally changed how people discover and interact with our content. Success is no longer measured solely by pageviews, sessions, or conversions. It’s also measured by how easily your content can be found, understood, and surfaced by search engines and AI-powered tools. Analytics remain an essential part of evaluating your website, but they should be considered alongside broader indicators of your content’s visibility, relevance, and usefulness.
Metrics Still Matter
As mentioned previously, you still need to use analytics to understand how users interact with your content. While every metric provides value, some offer deeper insight into user behavior and are especially helpful when evaluating your website’s effectiveness.
Because most WordPress site editors have access to Siteimprove Analytics—and it is Wake Forest’s preferred platform for measuring website performance—we’ll focus on the metrics available within it at a high level. While this is not an exhaustive list, these are the key measurements we recommend using to better understand how visitors engage with your website and to help inform future content decisions.
While we’ll cover the fundamentals of each metric below, you can visit the Siteimprove Analytics section to learn more about how each metric is used within the platform, how to navigate the associated reports, and how to interpret the data.
Instructions on where to find and analyze your site’s page data within Siteimprove can be found on the Analytics Content page.
Content is often the most frequently used area of website analytics because it provides valuable insight into what information users are seeking and where your communication and marketing efforts should be focused. Metrics such as pageviews, unique pageviews, and visits are easy to understand and offer a useful starting point for evaluating content performance.
However, these metrics tell only part of the story. As generative AI continues to change how people discover and consume information, page-level traffic alone no longer provides a complete picture of your website’s effectiveness. Even so, understanding which pages users visit—and how those pages contribute to your broader content goals—remains one of the most valuable ways to understand audience interests and identify opportunities for improvement.
Page metrics
The Pros (reasons to pay attention to this data)
- View how much traffic your website receives from direct and organic sources.
- Compare pageviews and visits to better understand how often pages are viewed and how many user sessions they generate.
- Identify your highest- and lowest-performing pages to uncover opportunities for improvement.
- Explore supporting metrics for individual pages to better understand user behavior and evaluate content effectiveness.
The Cons (why you should remain cautious)
- As previously stated, pageviews are no longer a reliable measure of user engagement on their own. The rise of zero-click searches and generative AI has changed how people discover information, meaning many users now find answers without ever visiting a website. Therefore, more people may be consuming your content in ways you’re not able to track through pageviews alone.
- Even when someone does visit a page, pageviews provide very little context. They don’t tell us why a visitor arrived, whether they found the information they needed, or if the page was simply a stop along a larger journey. Multiple pageviews within the same session can indicate strong interest, confusion, or something in between. Without additional context, pageviews alone cannot accurately measure how users engage with your content.
Navigation depth
Navigation depth measures the average number of clicks—or pages visited—it takes for a user to reach a specific page on your site regardless of where they enter your site from.
The Pros (what to pay attention to)
- Identify the average number of clicks (pages visited) it takes your users to get to the final page on your site they visit before leaving.
- Provides insight on how long it takes for someone to move around and your site.
- Surfaces barriers that may be preventing your users from finding your content quickly.
The Cons (what it doesn’t tell you)
- Users can enter your website on any page, so the number of clicks it takes to reach another page on your site will vary depending on where they begin.
- Depending on your site’s size and structure, visitors may reach key content efficiently—or they may have to navigate multiple pages, backtrack, or search repeatedly before finding what they need. Understanding the full user journey requires looking beyond entry pages to other behavioral metrics.
The Content Findability Triangle
To help users find the information they need—regardless of how they prefer to navigate your website—use the Content Findability Triangle as a guide for placing wayfinding elements on your site.
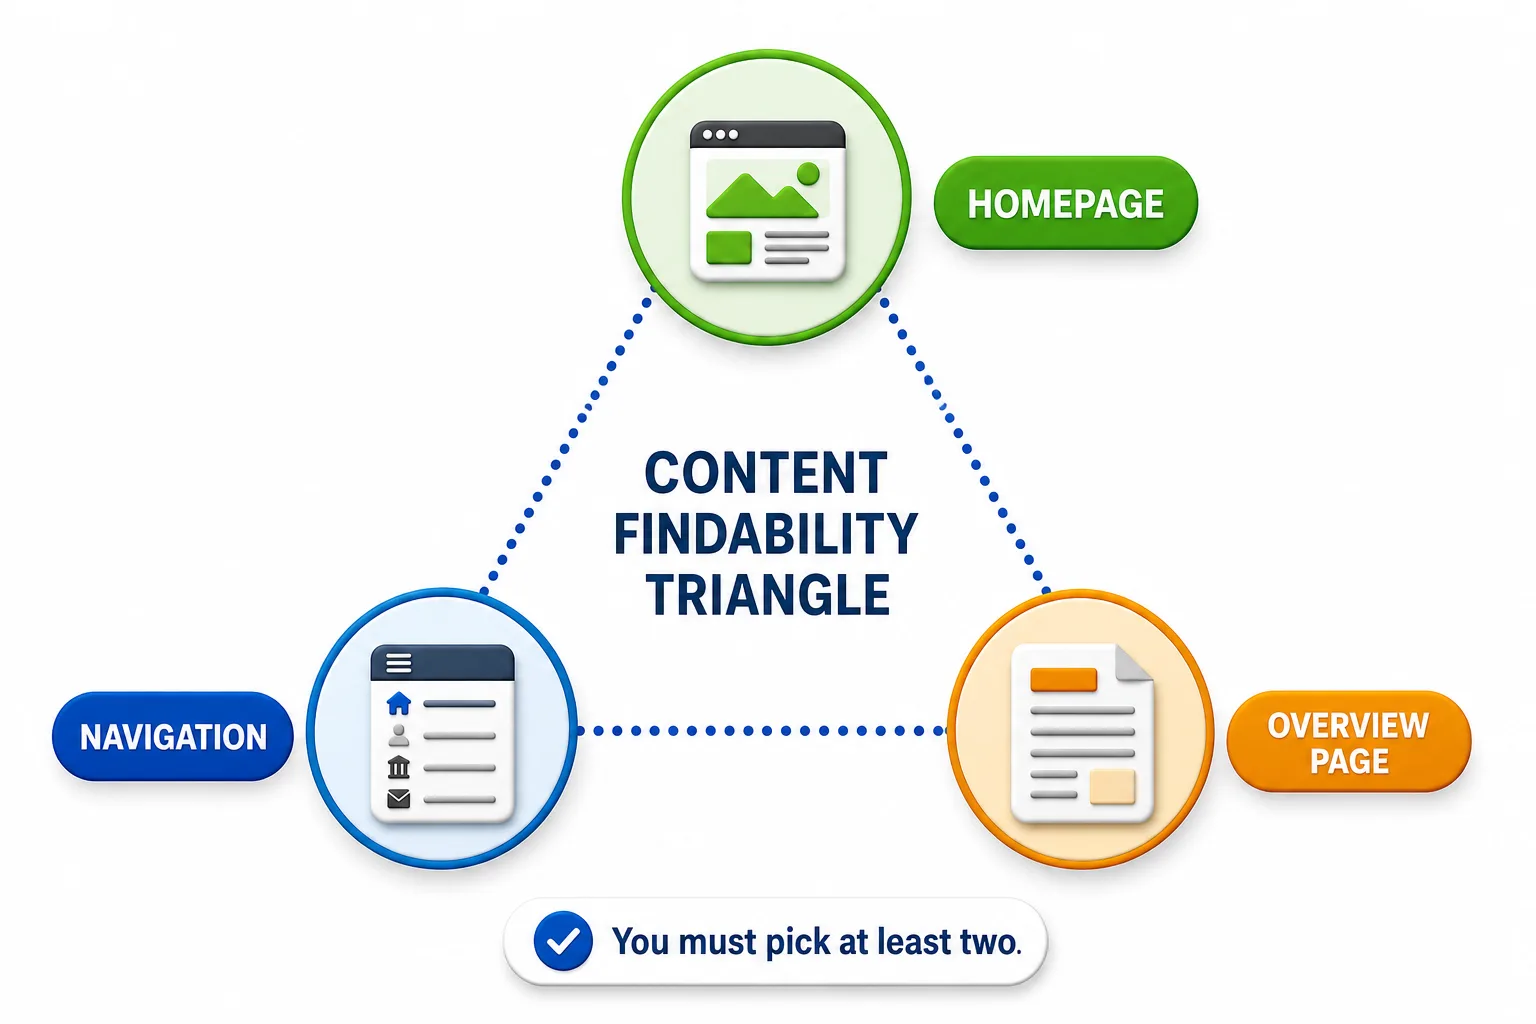
As a best practice, every important piece of content should be discoverable through at least two of the following pathways:
- Homepage: Provide content summaries and links to important topics in a format that’s easy to scan and takes users directly to the relevant page.
- Navigation: Include high-priority pages in your site’s navigation, either as a primary navigation item or within its dropdown menu.
- Overview Page: When content on a page contains several related topics or important details, create an overview page that introduces the section and directs users to the content they need.
Providing multiple paths to the same content makes it easier for visitors to find information, regardless of where they enter your site or how they choose to navigate.
Entries and Exits
Instructions on where to find and analyze entry and exit page data within Siteimprove can be found on the Analytics Entries and Exits page.
Entry pages are the first pages visitors see when they arrive on your website, while exit pages are the last pages they view before leaving. Together, these metrics provide valuable insight into how users enter, navigate, and ultimately leave your site.
Entry pages
Review your top entry pages and consider whether they align with your content goals and marketing strategy. Are visitors landing on the pages you expect, or are there pages attracting more traffic than intended? Understanding where users begin their journey can help you identify opportunities to improve navigation, optimize content, or better support common search behaviors.
Exit pages
Exit pages deserve similar attention. Ask yourself whether users are leaving from pages where their task has naturally been completed or from pages where you intended them to continue exploring your site. If visitors consistently exit from pages that should lead them to additional content, it may indicate unclear calls to action, missing information, or navigation challenges.
Bounce rate
Bounce rate provides additional context to how engaged someone is. A high bounce rate means a visitor entered your site on a page and left without viewing another page. While this can sometimes signal that users didn’t find what they needed, it isn’t always a negative outcome.
Pages designed to direct users to an external resource—such as an application, form, or third-party service—often have naturally higher bounce rates because their primary call to action takes visitors away from your website. For most other pages, however, your goal should be to encourage users to continue exploring your site until they have successfully completed their task.
Referral Traffic
Instructions on where to find and analyze page referral data within Siteimprove can be found on the Analytics Traffic Sources page.
Referral traffic, or traffic sources as it’s referred to in Siteimprove, shows us where visitors come from when they arrive on your website. You can identify the channels and sources users rely on to discover and access your content, such as external websites, paid marketing campaign ads, search engines, and so on. Google Analytics (GA4) provides similar insights using comparable traffic source metrics.
Depending on your content goals and marketing strategies, some traffic sources may be more valuable than others. The sources you prioritize should align with how your audience is expected to find and engage with your content.
For websites focused on external audiences, such as prospective students, families, or the general public, you may want to pay closer attention to sources like search engines, external referrers, social media, and AI-powered tools. These channels can provide insight into how users discover your content beyond being on a wfu.edu site.
For content designed primarily for internal audiences—such as current students, faculty, or staff—internal referrers may provide more meaningful insights by showing which other Wake Forest websites or pages are directing users to your content.
Direct traffic can also provide insight into both internal and external audiences, as it often comes from users accessing your site through bookmarks, saved links, or URLs shared through email and other direct communications.
User Behavior
Instructions on where to find and analyze user behavior data within Siteimprove can be found on the Analytics Behavior page.
Up to this point, we have focused primarily on quantitative data—metrics that provide a relatively objective, numerical view of website performance. User behavior shifts the focus to how people actually interact with your content, providing insight into the ways users engage with individual pages and the elements they contain.
User behavior metrics encompass a wide range of data. Behavior maps can help you understand how users interact with a page, including what they click on and how far they scroll. Siteimprove’s Behavior Maps feature allows you to view this data across both desktop and mobile devices, making it easier to understand how users engage with your content in different contexts and identify both successful elements and potential areas for improvement.
There are limitations to using Behavior maps. In many cases they need to set up on a page-by-page basis, meaning they aren’t able to measure interactions throughout your site (refer to event tracking if you’re interested in this feature). If you want to use a Behavior map, consider a page on your site that has established call to actions and tasks you want your visitors to complete in order to complete a goal. You can use the data you collect to see if they are clicking on the links you want them to click on, scrolling down on the page to get to important content, or performing another task that aligns with your content goals.
A/B Testing
Another valuable use of Behavior Maps is A/B testing, which involves presenting two versions of an element on a page—such as two differently styled buttons that lead to the same destination—to your audience. You can then compare the results to determine which version performs better based on your specific goal.
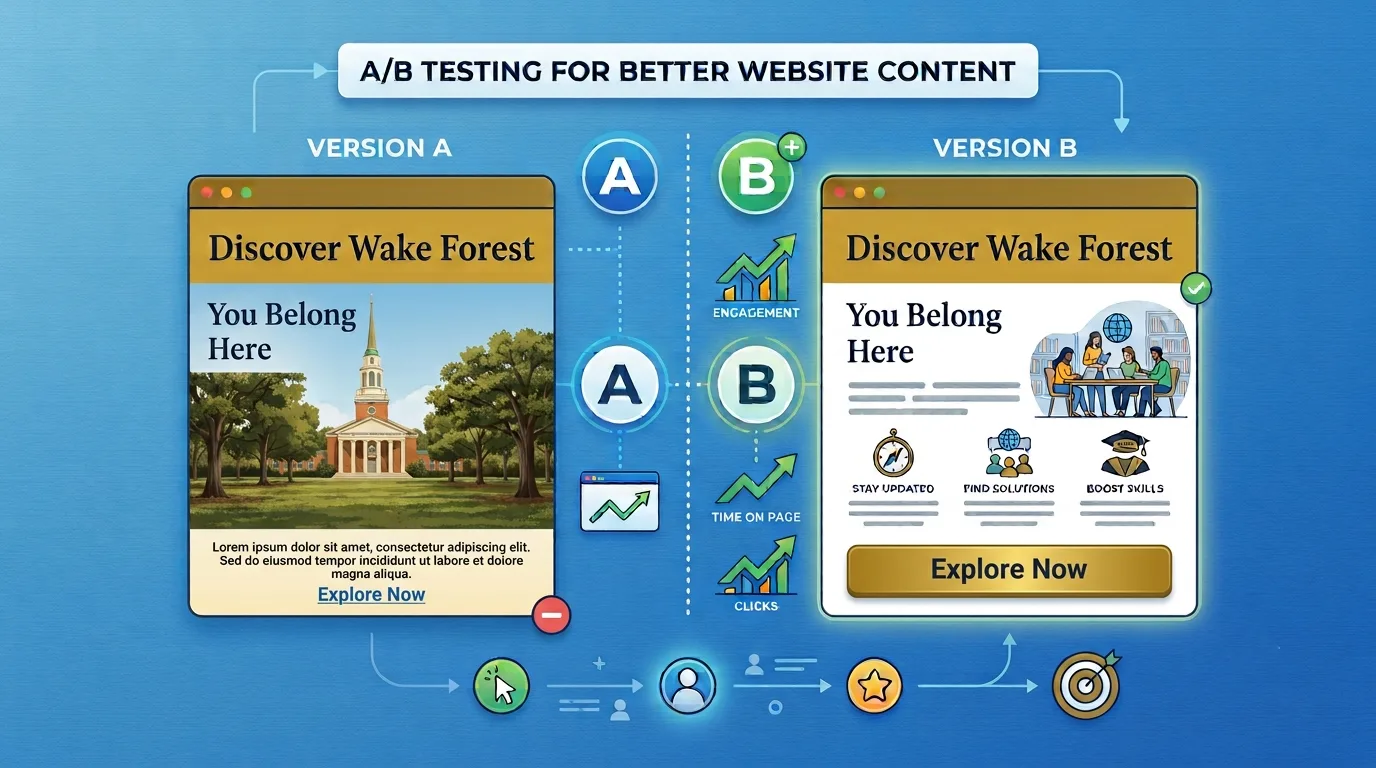
A/B testing is most useful when you need to make a data-informed decision about a change that could affect user behavior or overall performance.
Because A/B testing involves evaluating different approaches before deciding which one to implement, testing should be conducted in a PPRD environment whenever possible. This allows you to compare options without publishing untested content to your live site until you have determined which version performs best.
Event tracking
Event tracking provides insight into how visitors interact with specific elements on your site. These metrics help digital teams and marketing professionals understand where users look for information and which page elements they engage with most, making it easier to prioritize content and identify opportunities for improvement.
The benefits of event tracking are discussed in more detail on the Siteimprove Analytics: Behavior page, but here are a few key takeaways:
- Navigation: See how many users rely on your site’s main navigation and which links they select.
- Videos: If you embed a YouTube video on your site, track how often users play or pause it.
- Accordions: Determine whether users are actually interacting with accordion components to reveal hidden content.
If you think event tracking could help you achieve your content strategy goals, contact the UMC Digital Team to schedule a consultation. We can help determine which interactions are most valuable to track and assist with setting up event tracking on your site.
Your Digital Strategy Toolbox

Content
A well-defined web content strategy drives user experience, content visibility, and overall website performance.

Analytics
Analytics help you uncover insights, identify trends, and guide improvements for your website content strategy.

GenAI & SEO
How people discover information has changed—and continues to evolve. Here’s why that matters and how to approach it.

Accessibility
An effective website is designed not only for its intended audience, but to ensure everyone can access its content.
Online Presentations
Whether you’re interested in attending an upcoming digital strategy presentation or want to revisit a previous one, explore the topics we cover and resources we share.
Glossary of Terms
Digital strategy involves a lot of terminology that can feel overwhelming. We’re here to help clarify some of the most common terms and concepts you’ll encounter.
Want to Chat?
We’re here to support your digital strategy efforts. Reach out with questions or schedule a consultation with us to discuss your website strategy.