
SEO and Search
How Search Engines Connect Users to Your Content
Search engines remain an important tool for finding information. In fact, Google processes more than 8.5 billion searches each day—roughly 100,000 searches every second.
While the rise of AI-powered tools is changing the search landscape, search engines remain a leading source of information. We should not underestimate the continued role of search or overlook how search behavior—and SEO itself—will continue to evolve in the future.
Note: This tutorial provides an overview of the Search module in Siteimprove’s and does not cover every available feature or capability.
Reviewing Google Search Keywords and Pages
In this tutorial, we’ll explore the SEO and search features available in Siteimprove. Understanding the keywords and phrases visitors use to find your content is an important part of developing an effective content strategy.
Traditional SEO Still Matters
ChatGPT. Google Gemini. Apple Intelligence. AI-this, AI-that.
The AI revolution isn’t on the horizon—it’s here and in full swing. It’s built into our smart devices, our cars, and, perhaps most importantly, the way we search for information online. Many of us use AI every day without even realizing it.
AI is changing how people learn about us and gather information from our websites—often without ever visiting them. But this section isn’t about AI. It’s about traditional SEO and the many users who still rely on search engines to find information and click through to our websites.
SEO isn’t going away anytime soon. Instead, it’s evolving alongside AI-powered search. The good news is that we have a convenient way to track what users are searching for, when our content appears in search results, and how many users click through to our websites.
Let’s explore search and SEO information in Siteimprove and what it means for your content visibility.
Step-by-Step Guide
Use the step-by-step guide below to learn how to review SEO metrics on your site. Please note that this guide is intended as a supplemental resource and is not a substitute for formal Siteimprove training offered by UMC and Information Systems.
If you have access to Siteimprove but have not yet completed formal training, please schedule a training session. We’ll help you become familiar with the platform and ensure you have the knowledge and resources needed to use it effectively.
Search Dashboard
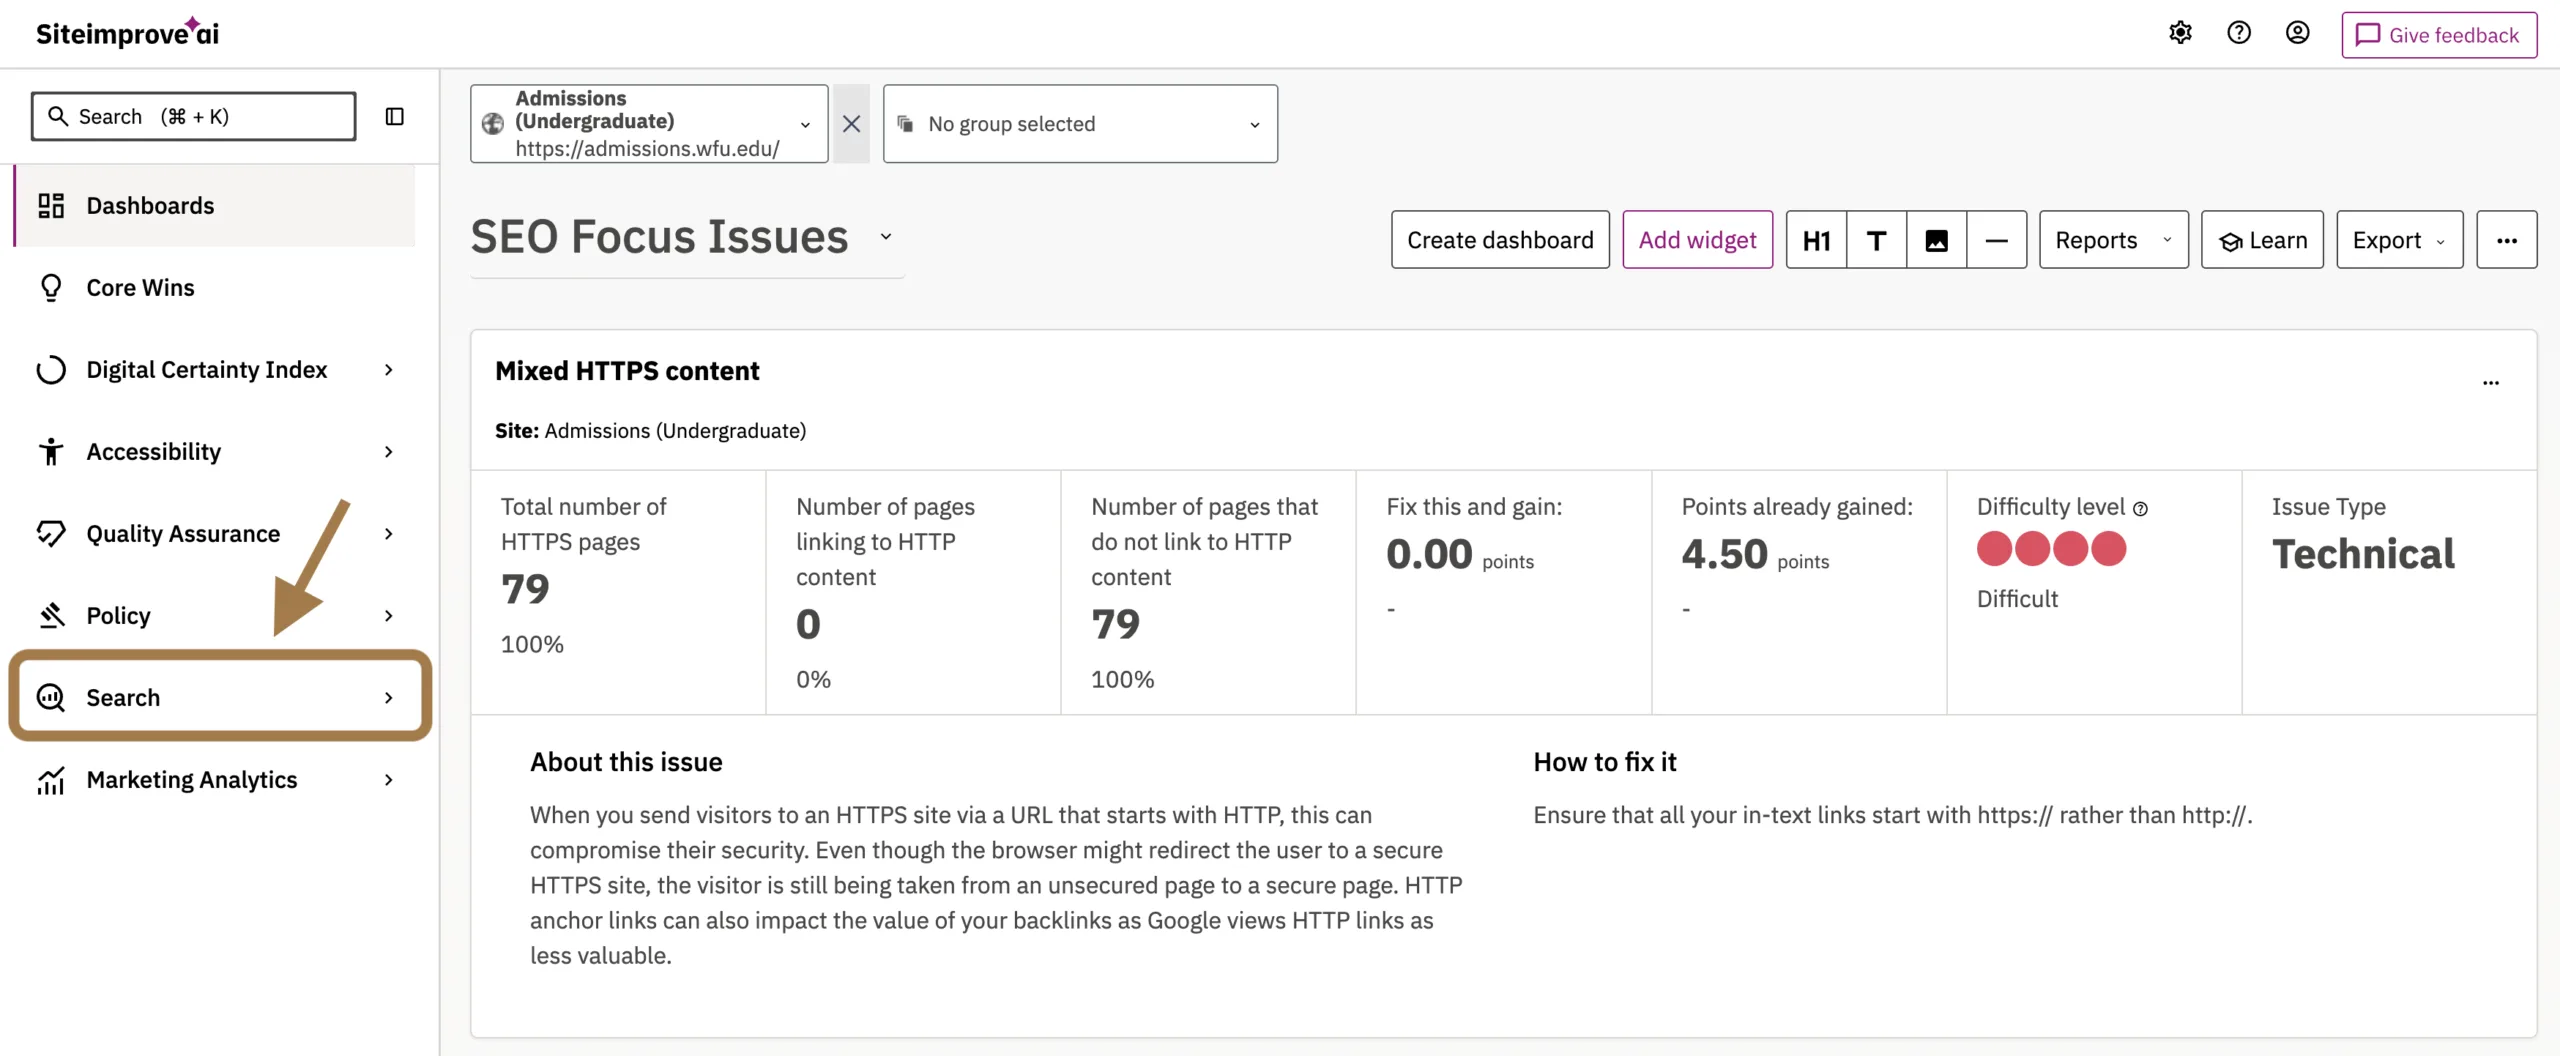
Once you’re logged into Siteimprove, select Search from the left-side navigation panel. This will direct you to the Search Dashboard.

Keyword Research
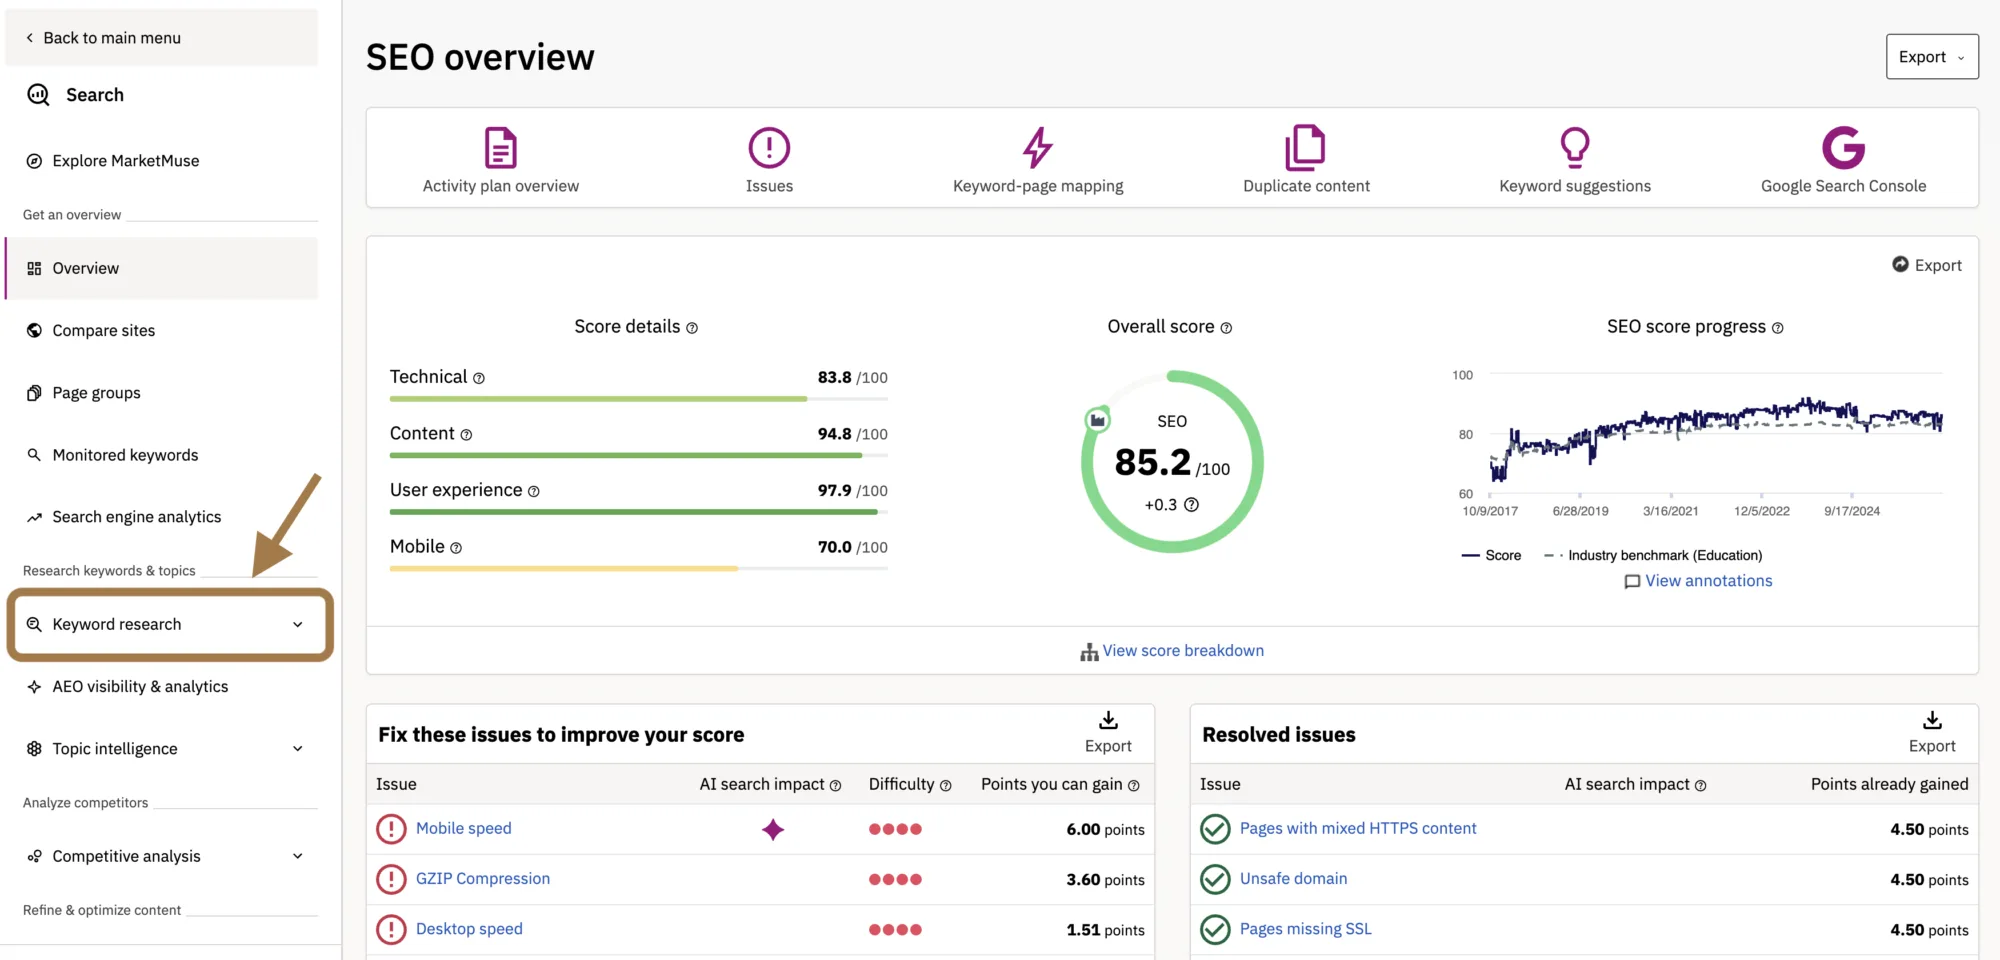
Click on the Keyword Research link that’s located under Research keywords and topics. Once selected, click the Google Search Console link that appears in the dropdown.
Google Search Console
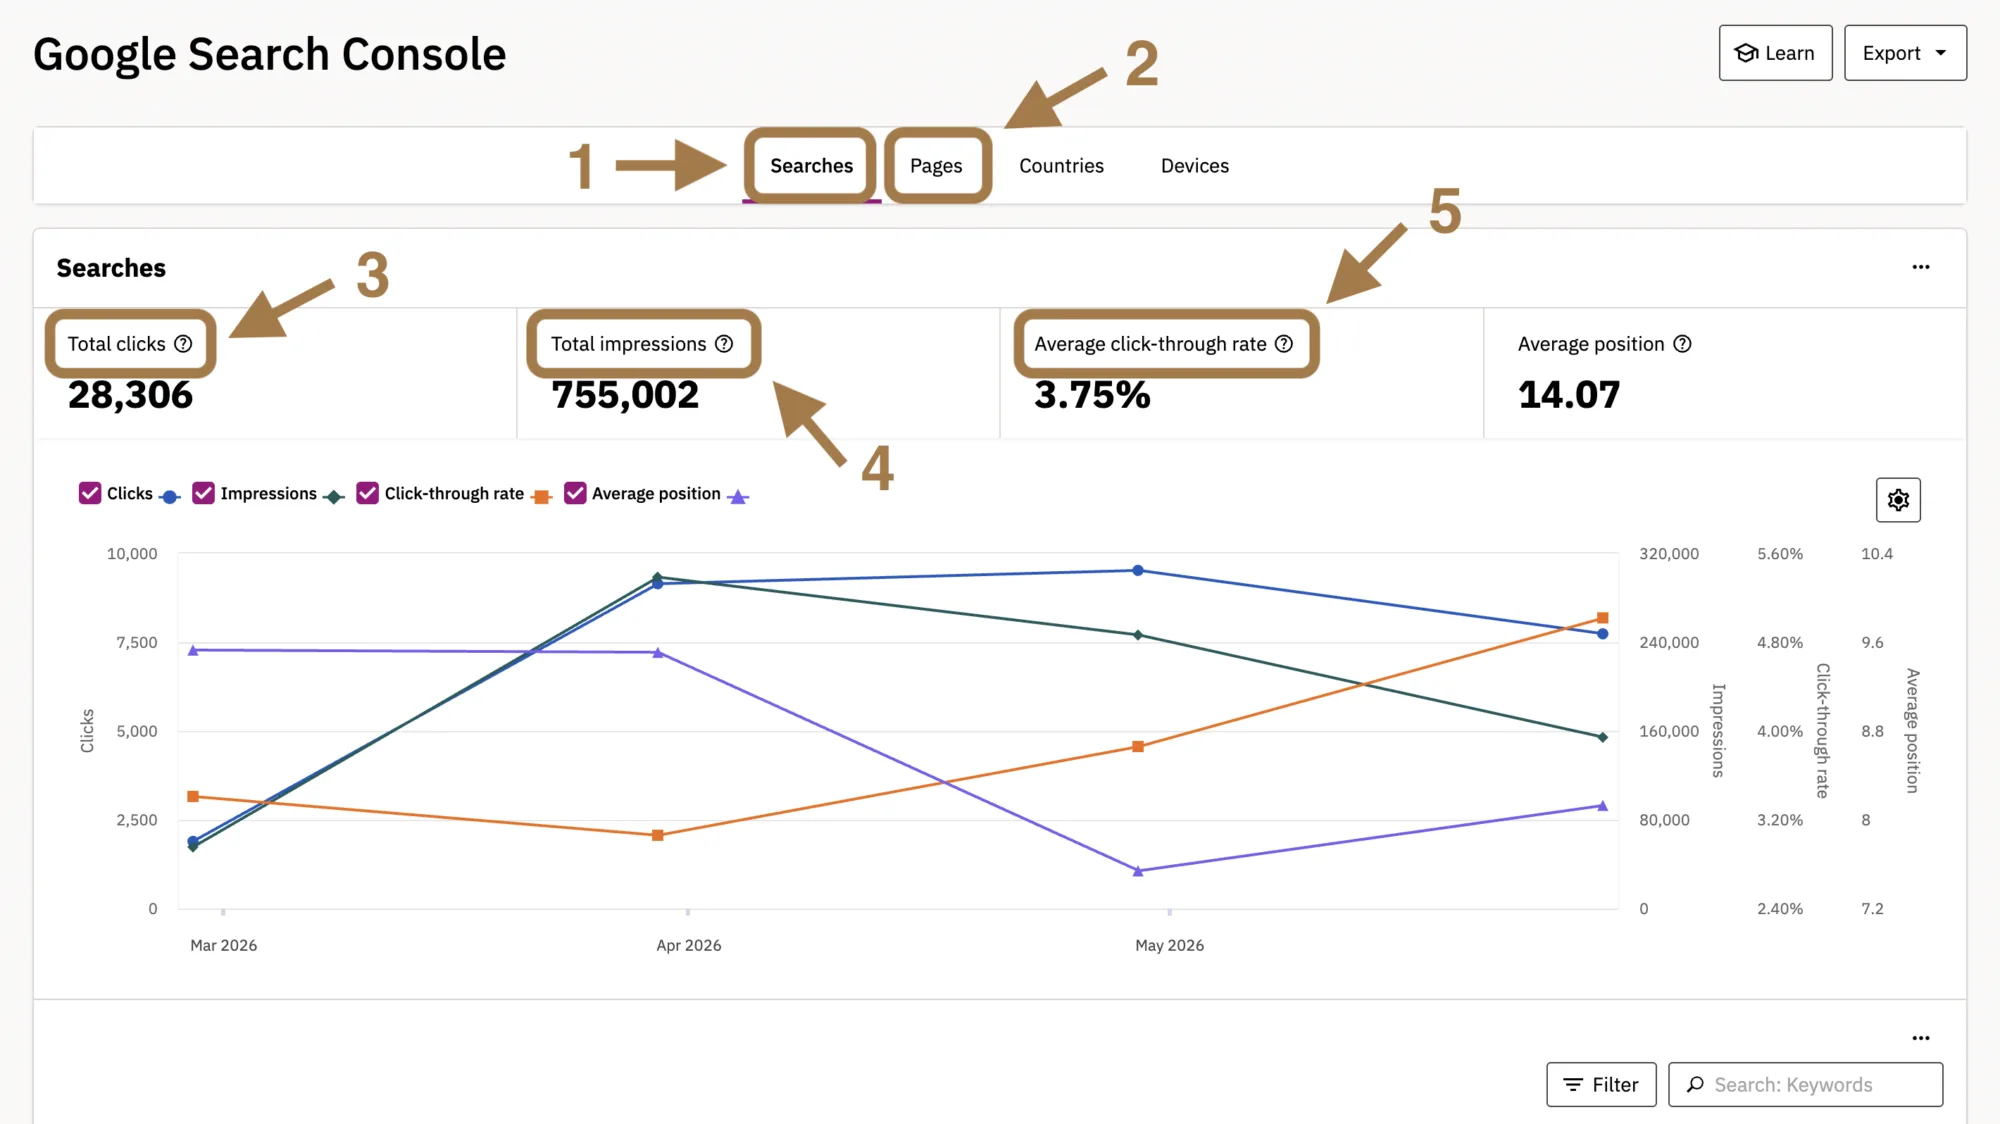
Here, you’ll find search and SEO data showing which pages on your site appeared in Google search results based on the keywords users entered. We’ll focus on two ways to interpret this data and three metrics used to measure overall performance.
Category and metric definitions
- Searches: Focus on keywords that were used where one or more pages on your site appeared in a search result.
- Pages: Focus on what pages on your site were discovered when one or more keywords were used.
- Total Clicks: The number of clicks on Google search results that led to your pages.
- Total Impressions: The number of times your pages appear in Google search results for a user.
- Average Click-Through Rate: The percentage of users who see your pages in Google search results who then click on them.
Searches
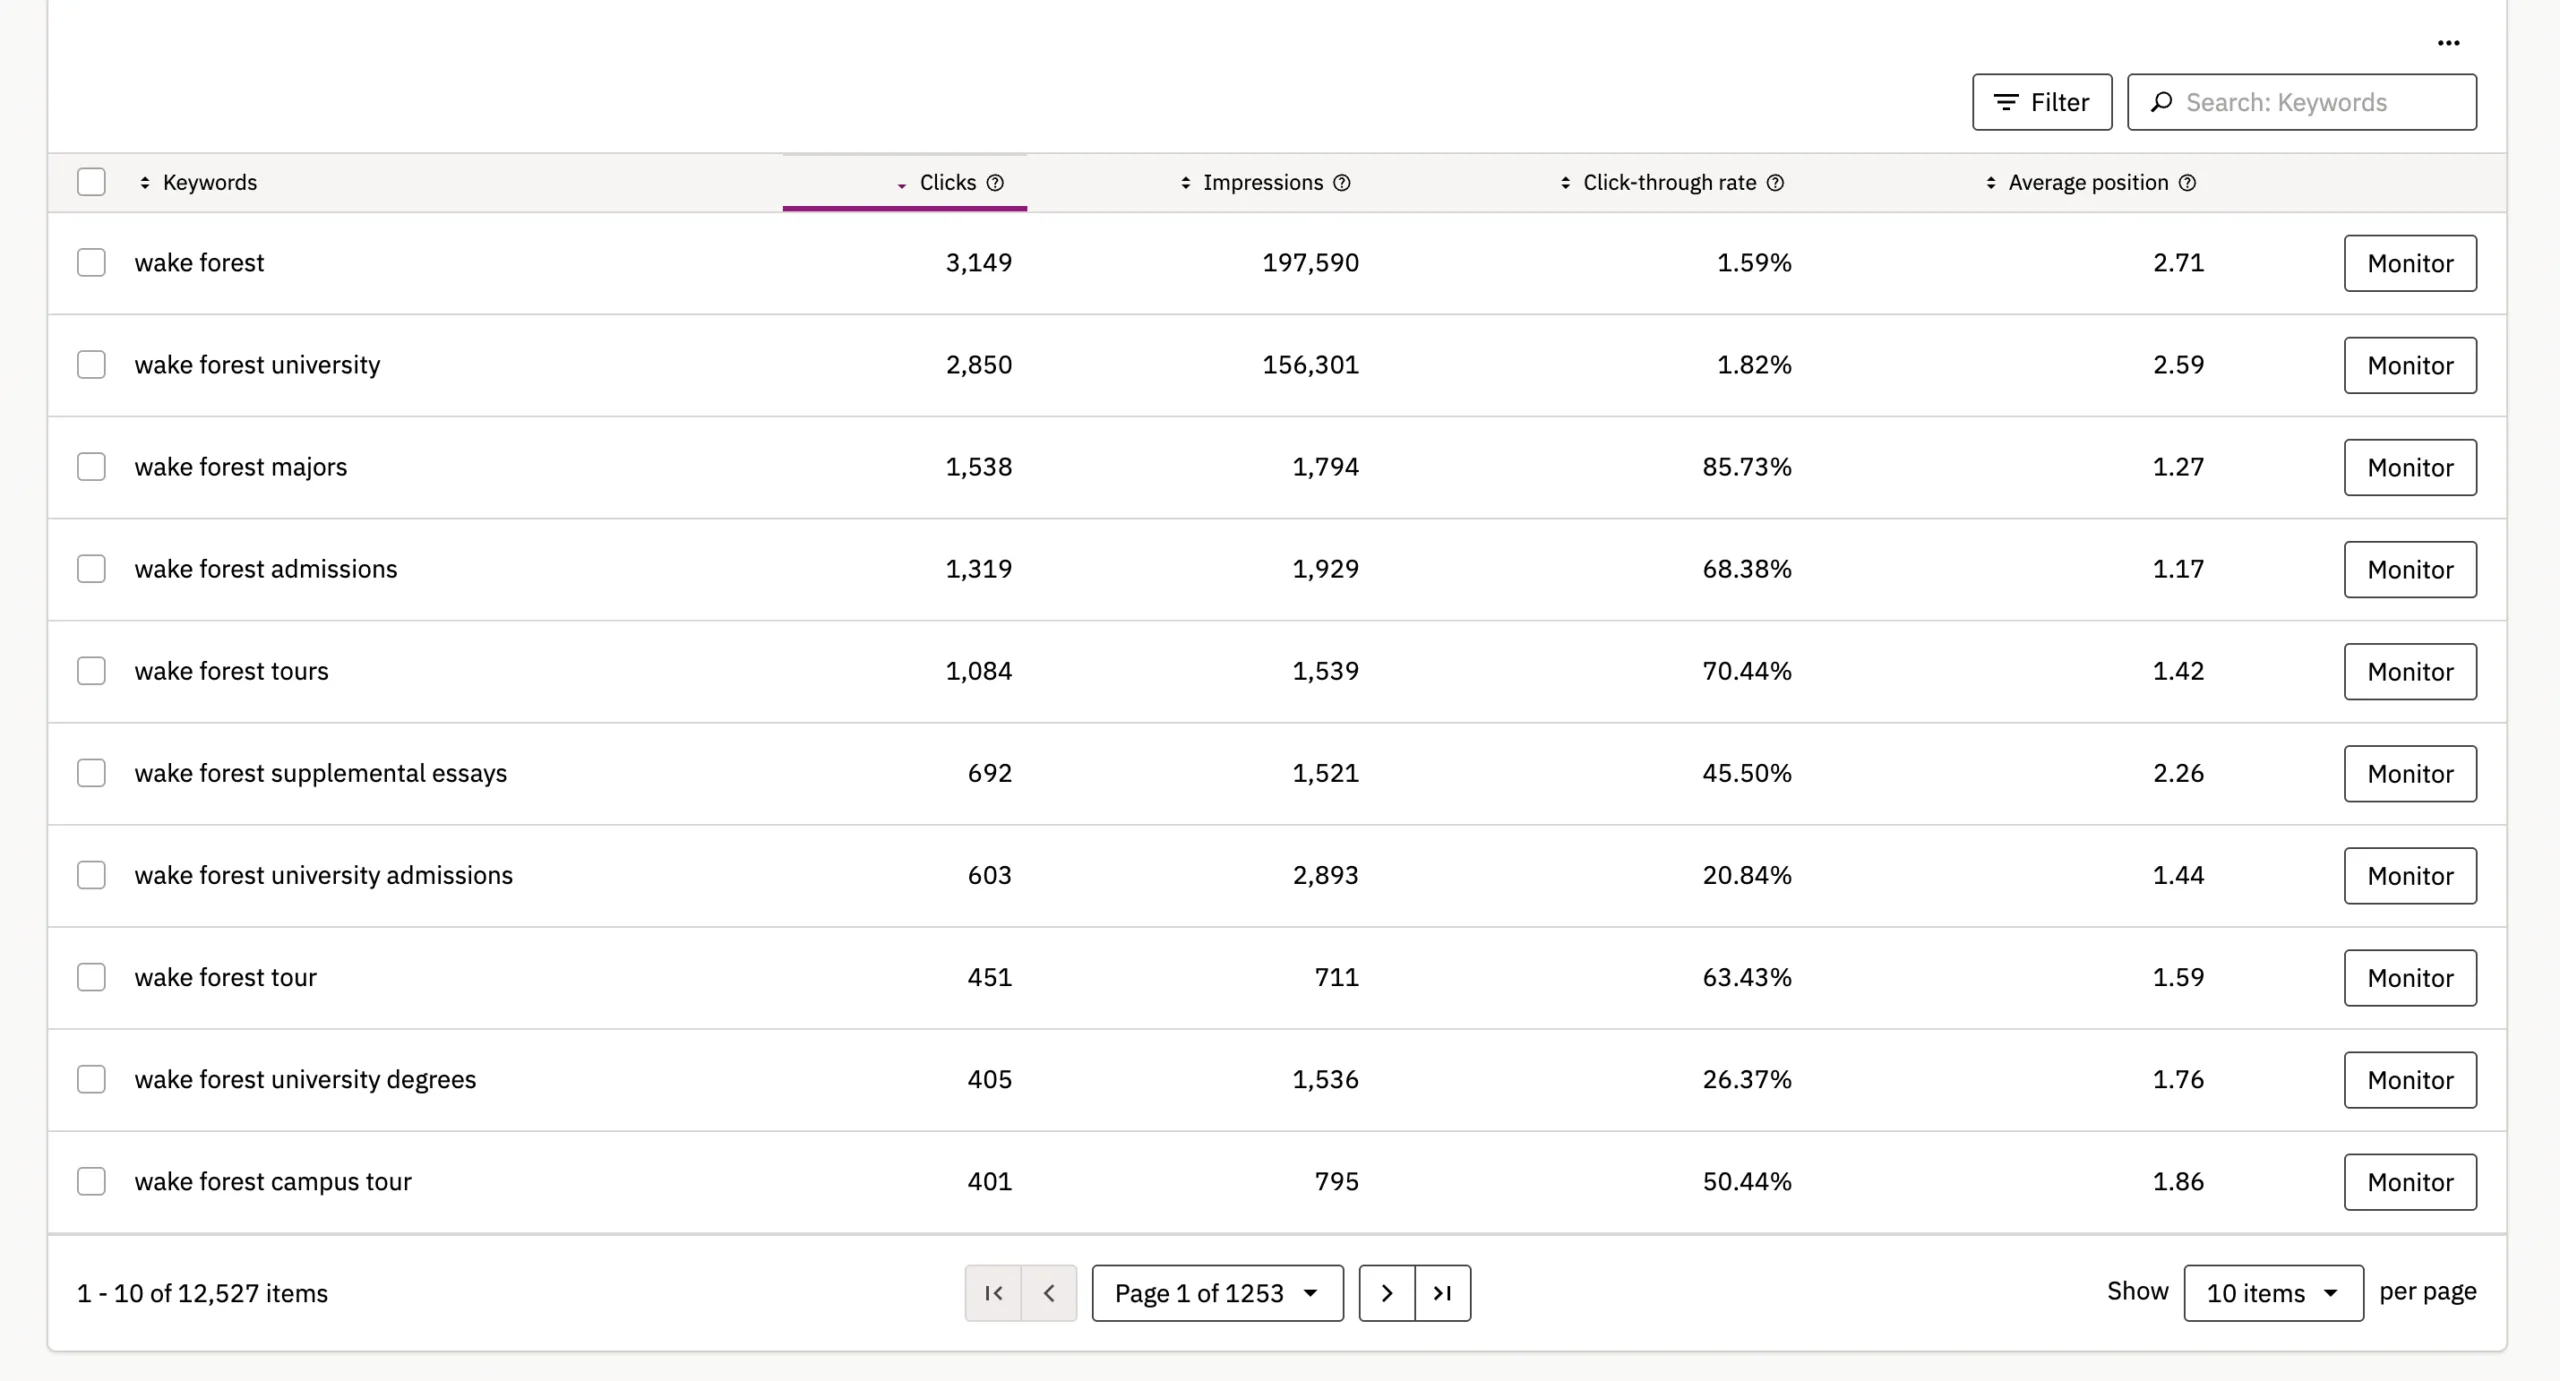
Select Searches to get started (refer to #1 in the previous screenshot). This is where we recommend you start when looking at search engine keywords and performance data.
In the Searches graph at the top of the page, you’ll see an overview of the keywords users entered in Google Search that led to pages on your site appearing in search results during the selected timeframe. The graph includes Total clicks, Total impressions, and Average click-through rate (refer to items 3–5 in the previous screenshot). While these metrics provide a general sense of your content’s visibility and performance, we’ll focus on the Keywords table directly below the graph.
The table shows the keywords users entered in Google Search when one or more pages on your site appeared in the results. Understanding which keywords lead users to your content—and how often they click a search result that takes them to your site—can help inform your content strategy. This information gives you a clearer picture of what people are searching for and whether your pages appear in search results for those terms.
Pages
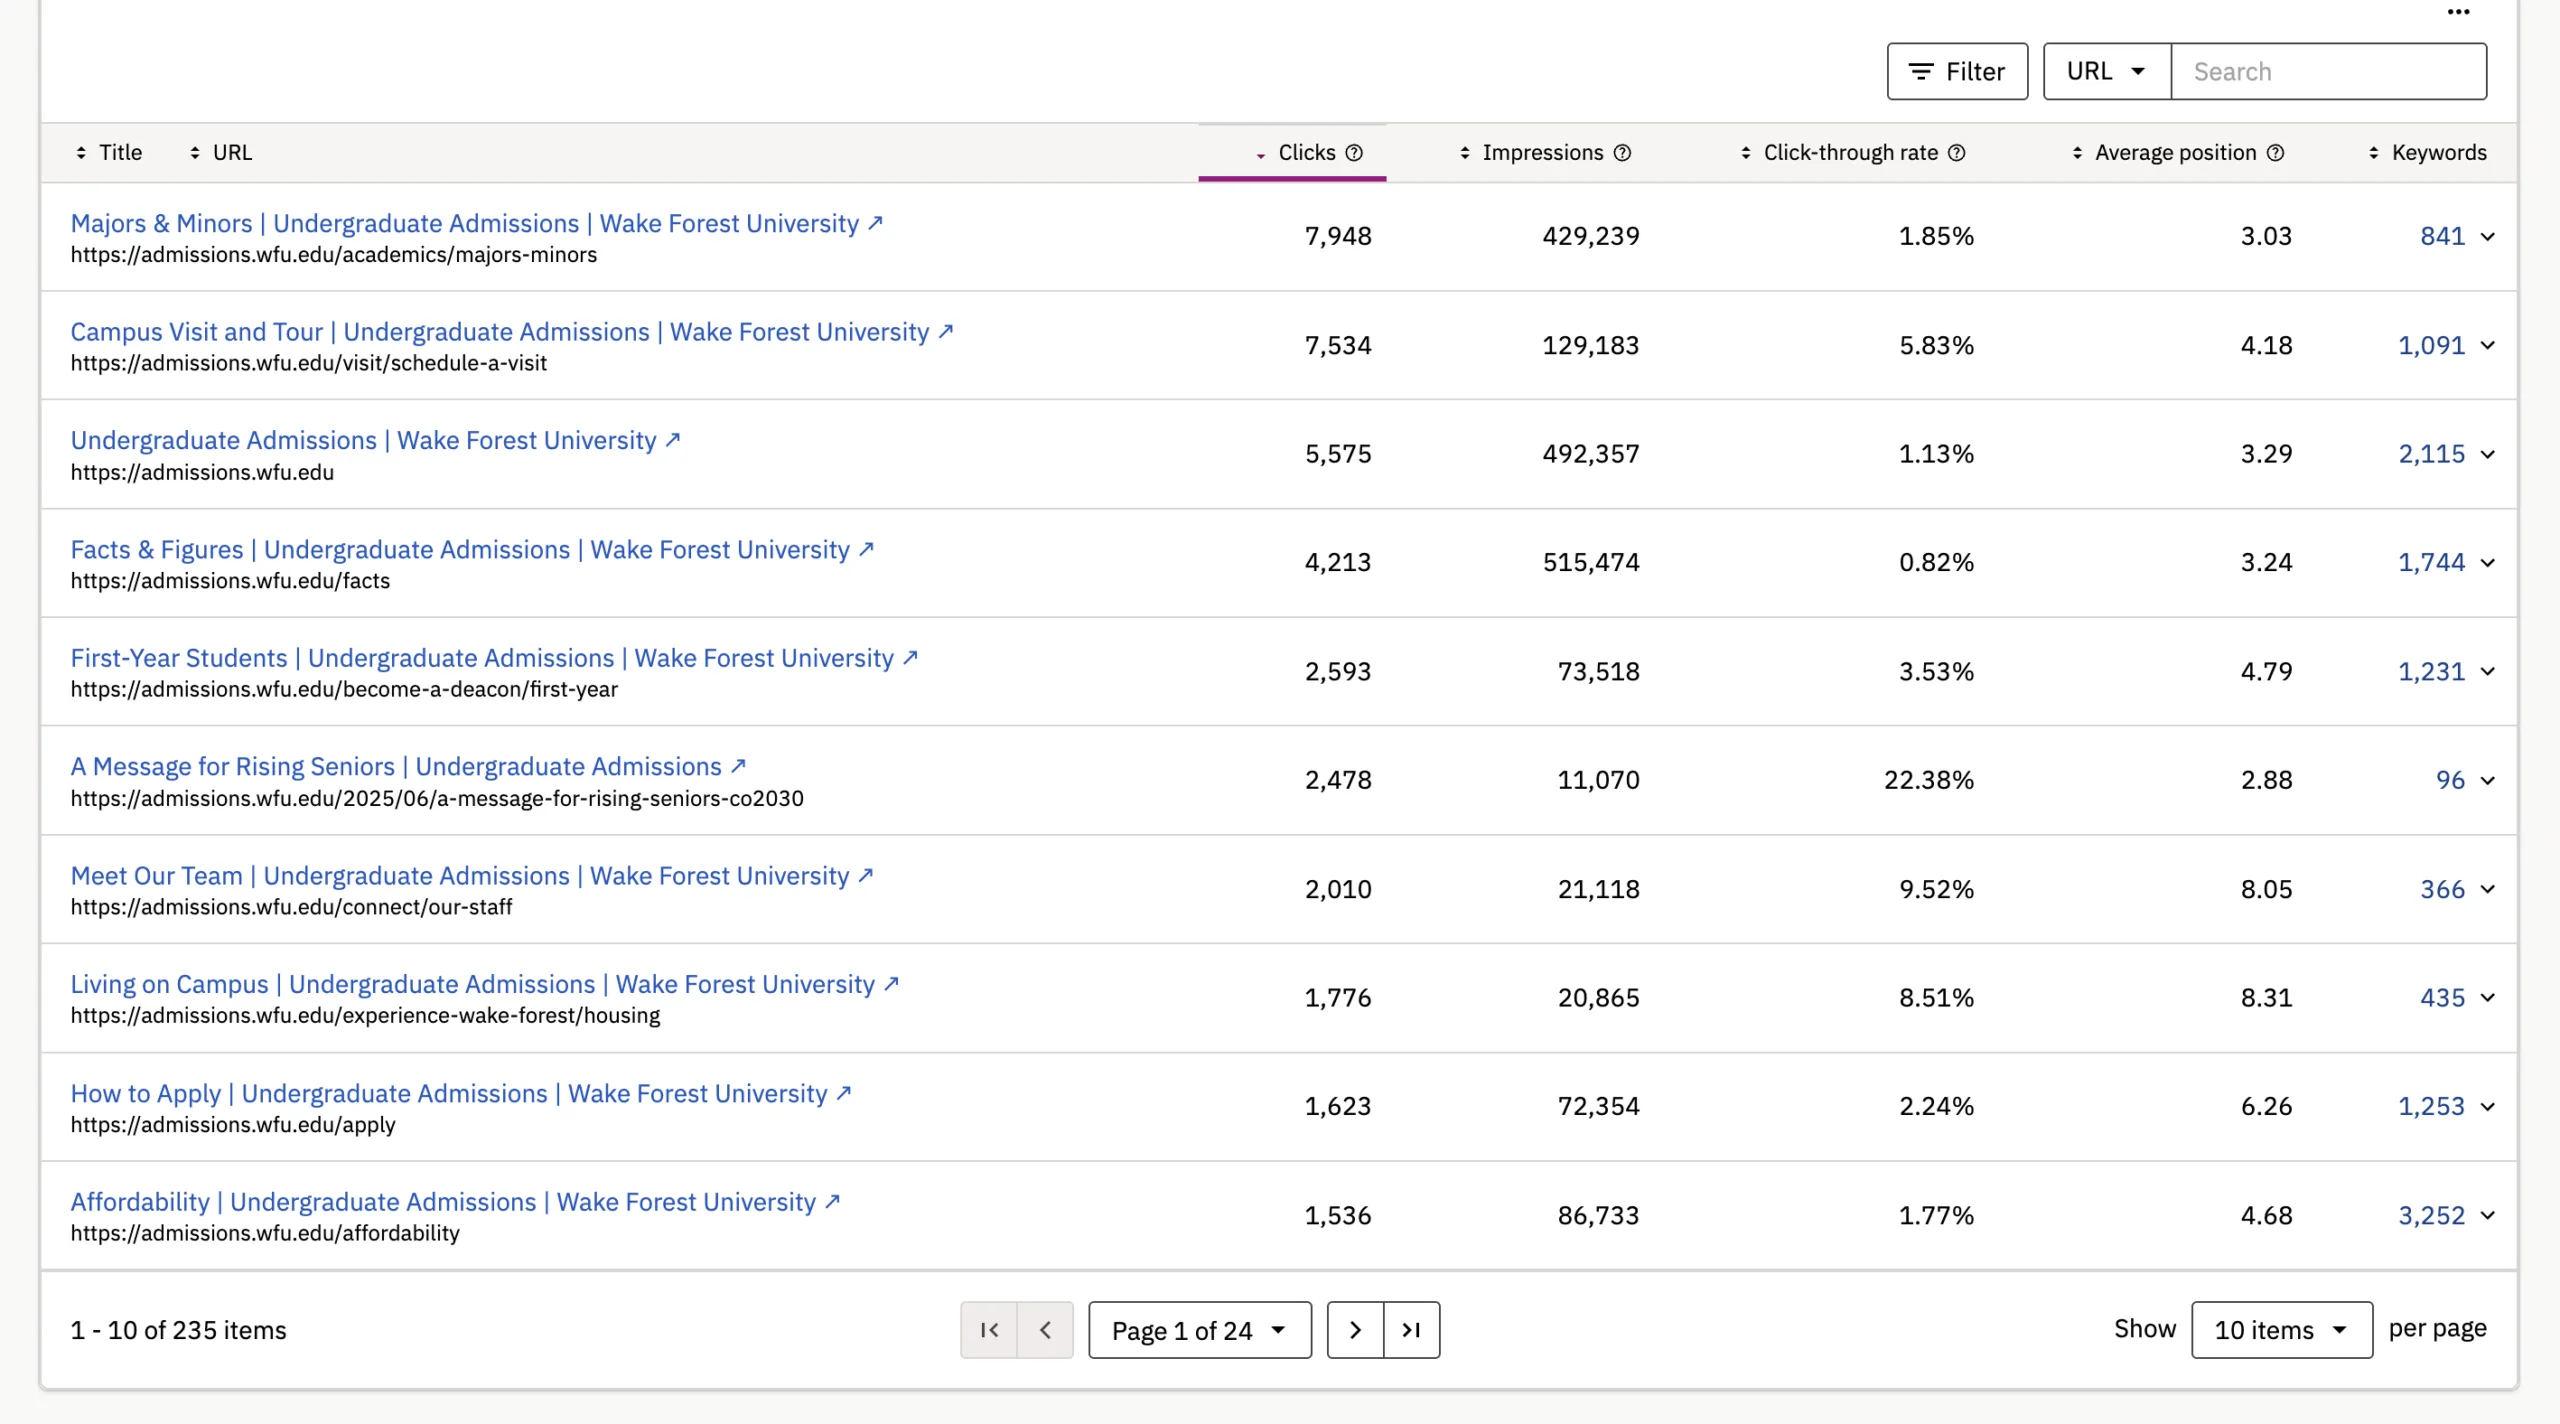
Select Pages (refer to #2 in the previous screenshot) if you want to get a better idea of what pages showed up in Google Search results when specific keywords were entered.
In the Pages graph at the top of the page, you’ll see performance data of your pages that appeared in Google Search results. The graph includes Total clicks, Total impressions, and Average click-through rate (refer #3–5 in the previous screenshot). While these metrics provide a general sense of your content’s visibility and performance, we’ll focus on the Pages table directly below the graph.
The table shows the pages on your site that appeared in Google Search results. To understand how often a page was displayed in search results and how often users clicked the link to visit it, focus on Impressions and Clicks, respectively.
Like keyword data, this information can provide valuable insight into what users are searching for and whether your pages are appearing in Google Search results. It can also help you identify which pages are most visible in search and which are most effective at driving users to your site.
Google Search Console (Standalone)
University Marketing and Communications (UMC) uses Google Search Console (GSC) to monitor search traffic and evaluate how effectively Wake Forest University web pages appear in Google Search results. Because GSC provides search data directly from Google, it offers a robust and authoritative view of your site’s search performance.
Siteimprove’s Google Search Console dashboard, which draws data from the university’s primary GSC account, provides a convenient overview of this information. If you need more specific search data than what is available in Siteimprove, submit a Siteimprove Support Request Form and we’ll be happy to help.
If you’re looking to improve your visibility in the university’s Google Custom Search engine—the global search feature on wfu.edu—you can submit a request to have your site or a specific page considered for prioritization in search results. All requests go through an evaluation process, and submission does not guarantee that a site or page will be prioritized or included as a recommended search result.
Your Siteimprove Toolbox

Quality Assurance
Discover the steps you can take to create a more effective, engaging, and user-friendly website experience for everyone.

Analytics
A successful content strategy starts with understanding how your website is performing and what your audience is looking for.

Accessibility
Accessibility isn’t just about what happens behind the curtain—it’s about the experience everyone has in front of it.

SEO & Search
Understanding how visitors find your website and what they want is an essential step in developing an effective content strategy.
Online Presentations
Whether you’re planning to attend an upcoming digital strategy presentation or want to revisit a previous session, explore the topics we cover and resources we share.
Digital Strategy
A strong digital strategy serves as the foundation for your website and every aspect of your digital marketing and communications. Here’s what you need to know.
Want to Chat?
We’re here to support your digital strategy efforts. Reach out with questions or schedule a consultation to discuss your website strategy and explore opportunities for improvement.