
Behavior
How Visitors Interact With Your Content
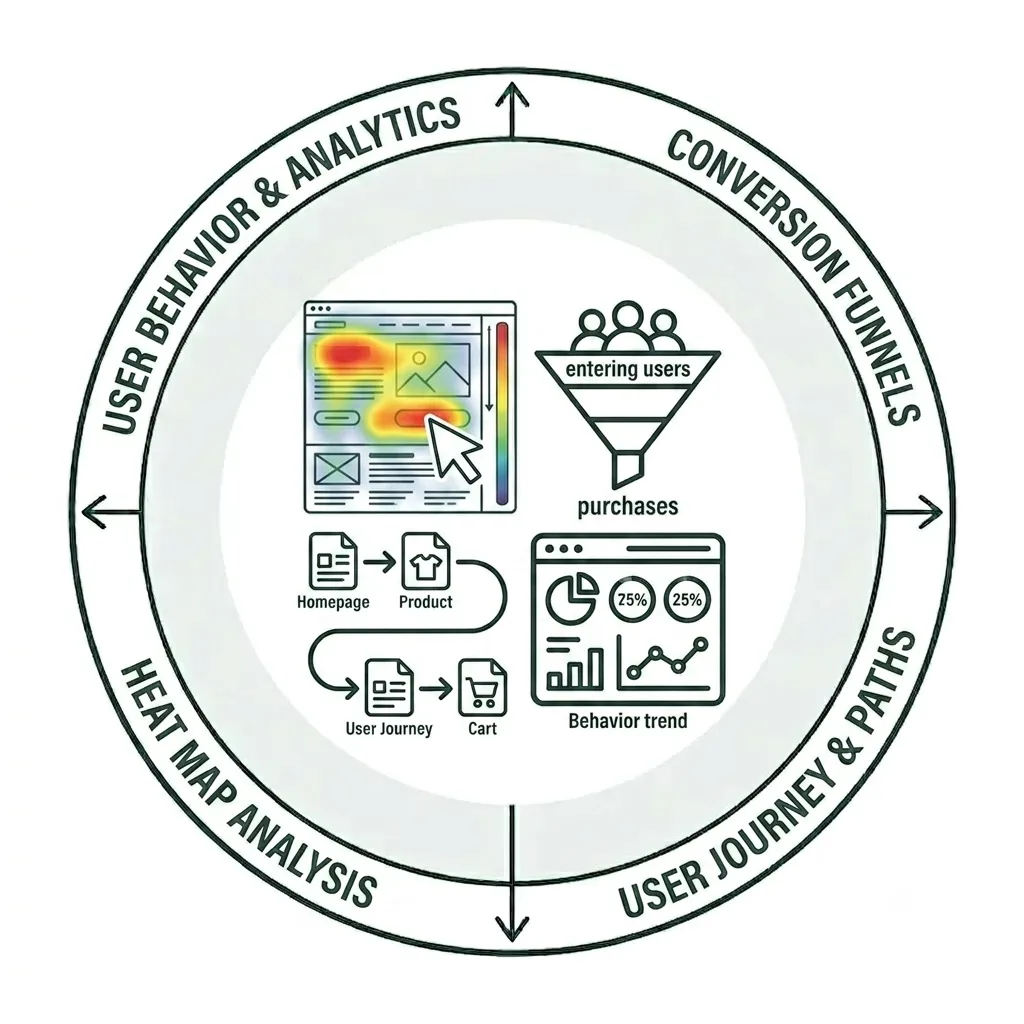
Have you ever wondered what someone is doing when they’re on a page on your site? Are they scrolling so they see all the content? Do they click links and buttons? Or do they just leave without doing anything? Using the Behavior feature in Siteimprove can help answer those questions and provide you with insight on what users care about on a page and where they may need a little help.
Note: This tutorial provides an overview of the Behavior feature in Siteimprove’s Analytics module and does not cover every available feature or capability.
Analyzing User Behavior
Siteimprove Analytics provides a wealth of data and insights into how users interact with your website. In this tutorial, we’ll explore the Behavior module, focusing on Behavior Maps and Event Tracking. Together, these tools help you understand how often specific interactions occur and which pages generate the most engagement, such as clicks and taps.
User Journeys
User Journeys show the paths visitors take between a starting page (A) and a destination page (B). They help you understand how visitors navigate your website and the routes they take to reach specific destinations.
User Journeys are most useful when you want to understand how visitors reach an important page on your website. The end page—the final destination in the journey—should typically include a clear call to action that encourages visitors to take a specific action, such as completing a form or clicking a button.
By analyzing the paths visitors take to reach these key conversion points, you can identify opportunities to make their journeys more effective and help more visitors complete the actions that matter most.
Once enough data has been collected for a User Journey, select a route to explore the different paths visitors took from your start page to your end page (as shown in the example below).
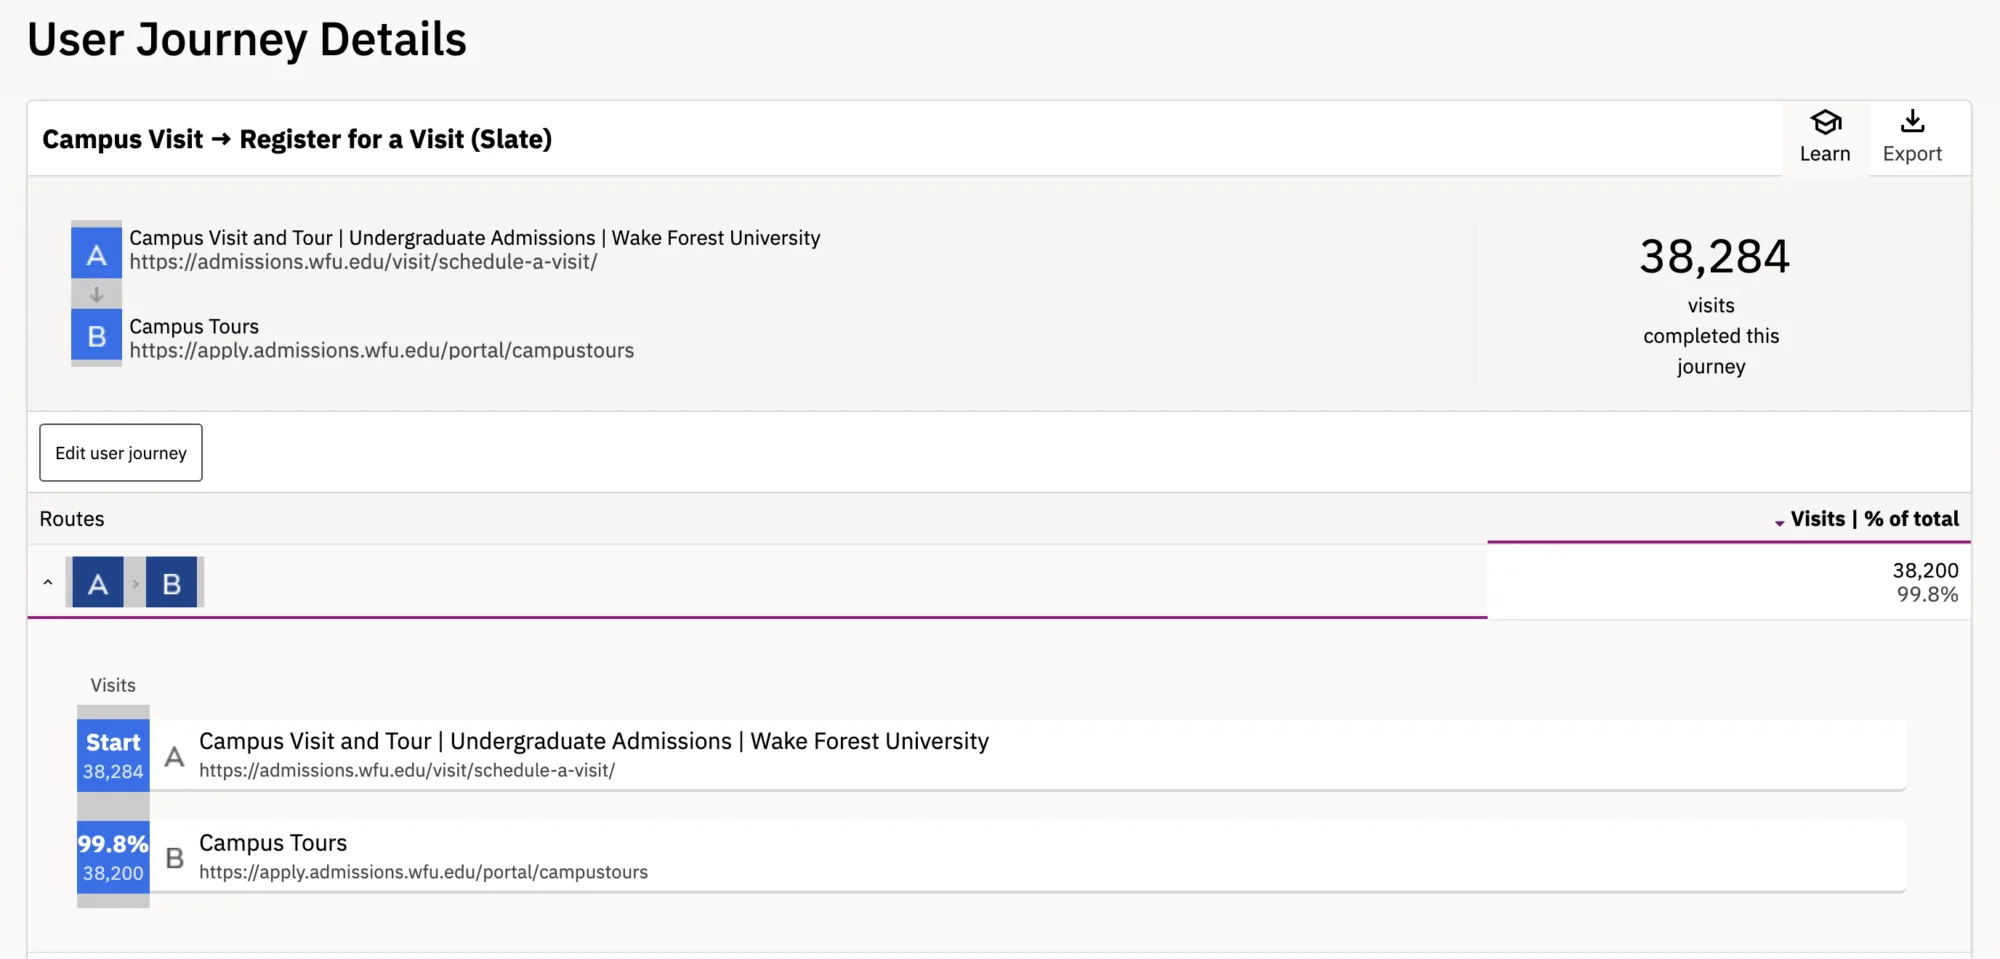
Routes are organized based on the paths visitors took most frequently between the start and end pages. Because visitors may navigate through different pages along the way, a single route may include multiple pages and variations in the paths they take before reaching the end page.
If you’d to learn more about user journeys and how to configure one or more on your site, let the digital strategy team know by submitting a Siteimprove Support Request Form.
Behavior Maps
Behavior maps are a powerful way to visualize how visitors interact with the content and elements on a page. They can help you identify both desired and unexpected patterns of behavior, providing insight into what visitors engage with, where they click, and how far they scroll.
Behavior Maps consist of five components:
- Segmentation Map
- Struggle Map
- Heat Map
- Scroll Map
- Click Map
It’s important to allow sufficient time—typically several weeks or months, depending on the amount of traffic your page receives—for enough data to accumulate before analyzing the results and drawing conclusions about how visitors interact with your page.
To view any of the Behavior map components, select a Behavior map you created from your dashboard. Siteimprove captures a screenshot of the page approximately every 24 hours, allowing you to compare visitor interactions with the page over time.
Let’s take a closer look at two examples of Behavior maps: Heatmaps and Scroll maps.
Heatmap
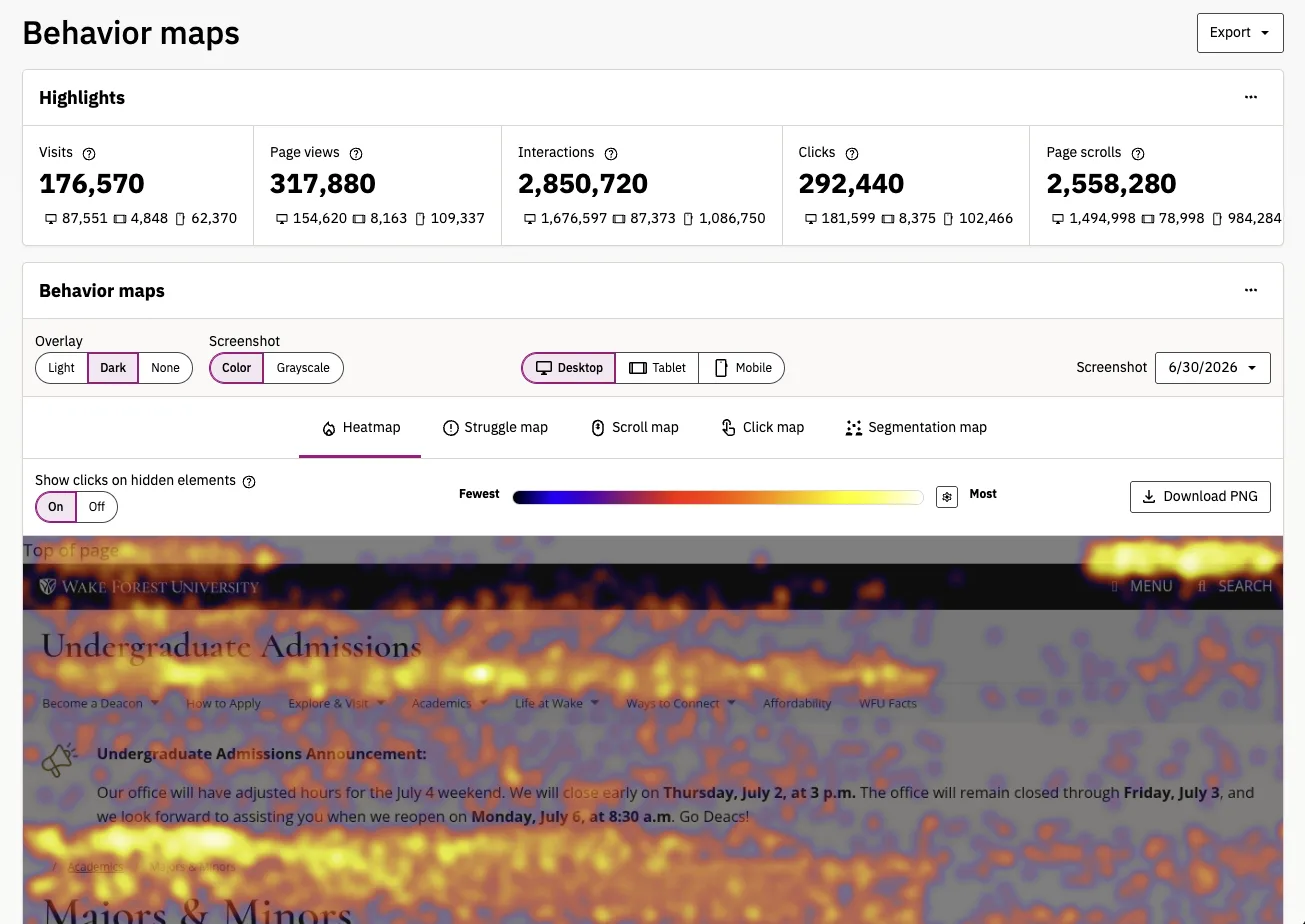
Heat Maps visualize where visitors click or tap on a page by overlaying interaction data on the page itself. Areas with more activity appear warmer, while areas with less activity appear cooler.
They can help you understand how visitors navigate and interact with your content—for example, whether they use the navigation menu, click links within the page, or select elements that are not actually interactive. These insights can reveal opportunities to improve your page’s content, layout, and usability.
Scroll map
The Scroll map shows how far visitors scroll down a page, helping you understand how much content they view before leaving or moving on. Like Heatmaps, Scroll maps use a color gradient to visualize visitor engagement, with darker areas indicating lower levels of attention and brighter areas indicating higher levels of attention.
Scroll Maps often reveal that many visitors do not reach the bottom of a page—and some may not scroll far beyond the top. While this might suggest that shorter pages are always better, that is no longer considered best practice.
Instead, focus on providing all the information visitors need about a specific topic, regardless of the page’s length. Visitors want to find the information they need as quickly as possible, while GenAI search tools can benefit from comprehensive pages that provide authoritative information in one place.
Whether your pages are short or long, your content should always be written for your users first. Place the information visitors are most likely to need near the top of the page, followed by supporting information. When you apply this approach consistently across your site, you can create a better experience for visitors while also making your content easier for traditional search engines and AI-powered search tools to understand.
If you’d to learn more about Behavior maps and how to set one or more on up on your site, let the digital strategy team know by submitting a Siteimprove Support Request Form.
Visit Depth and Length
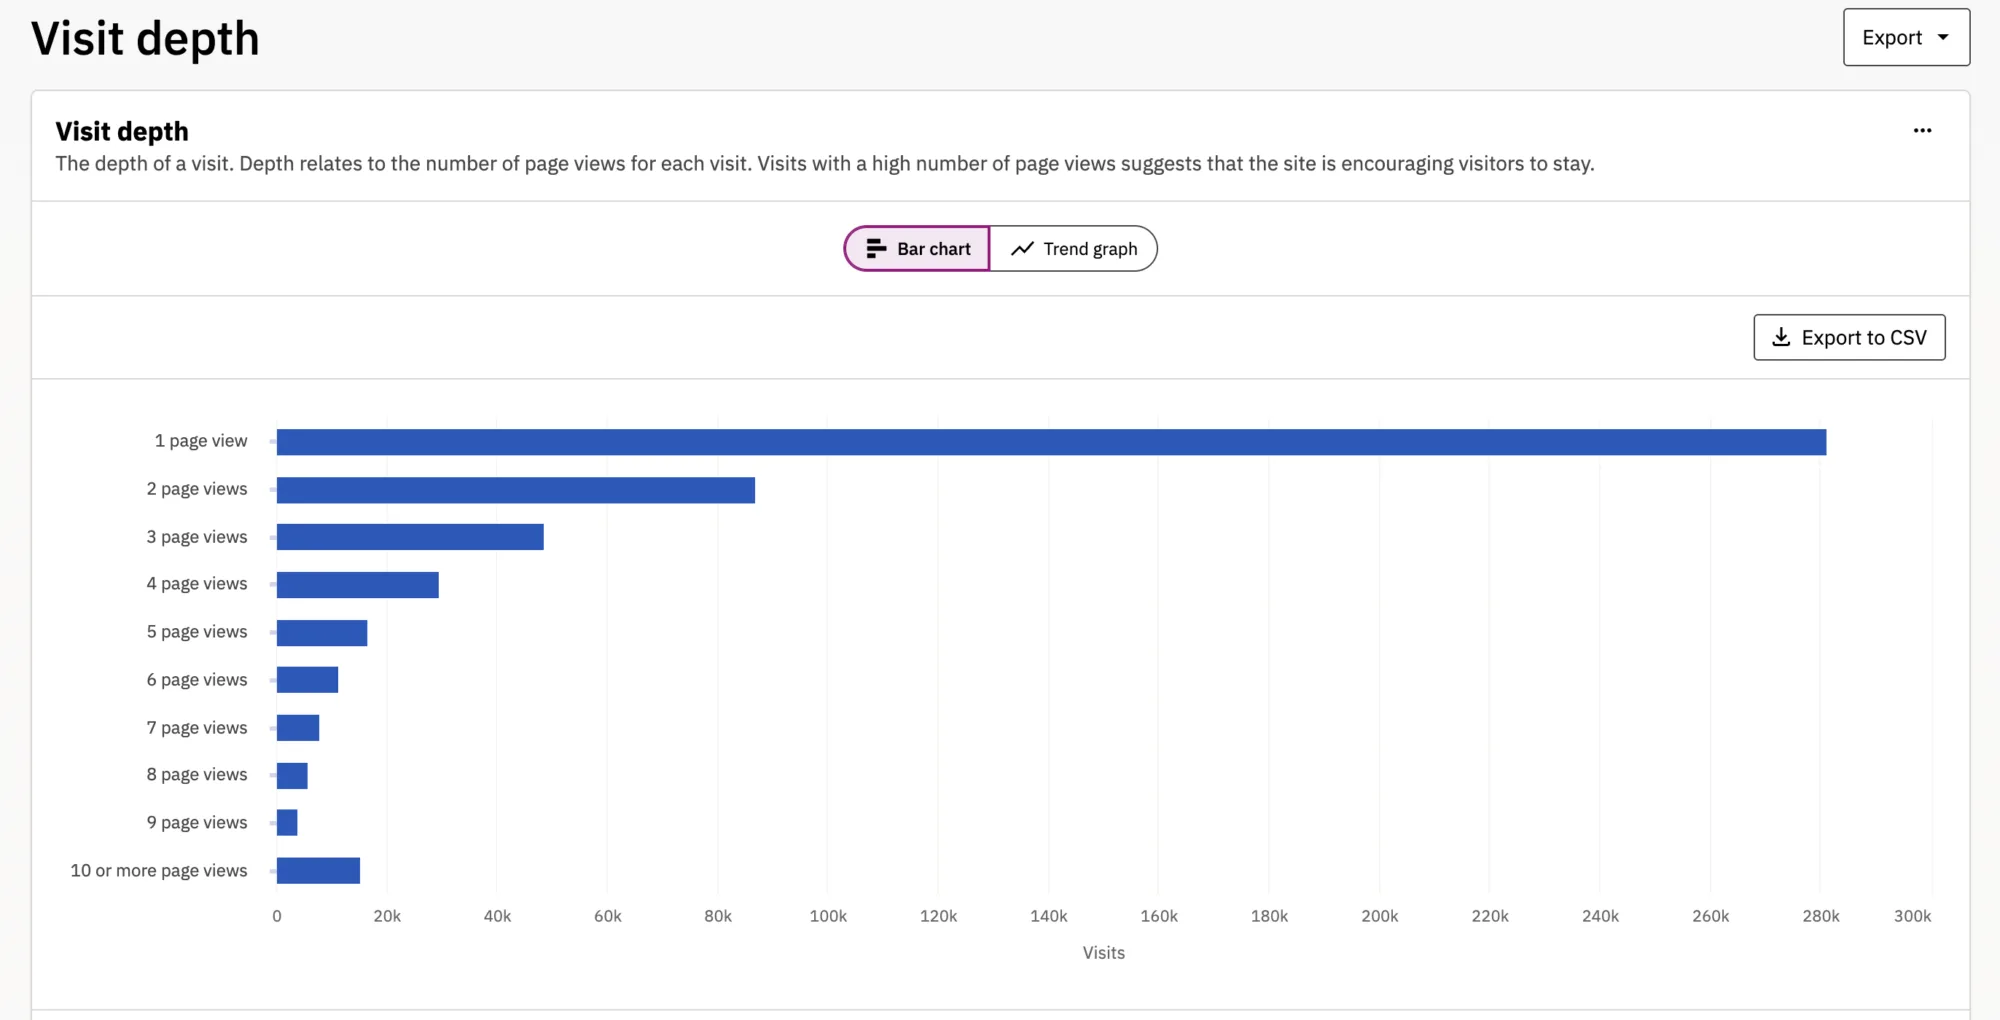
Visit depth measures the number of pageviews generated during a single visit. A high visit depth can indicate that visitors are engaged and exploring your site, but it can also suggest that they are backtracking or having difficulty finding the information they need.
If you suspect visitors may be struggling to navigate a particular page, consider setting up a Heat Map to gain more insight into how they are interacting with its content and links.
Visit length measures the amount of time visitors spend on your website during a single visit. It can provide insight into visitor engagement and how effectively your site retains visitors.
However, a longer visit does not always indicate a better experience. Visitors may be spending more time on your site because they are engaged with your content—or because they are having difficulty finding the information they need. For this reason, visit length should be considered alongside other metrics, such as visit depth and behavior data, to better understand how visitors are interacting with your site.
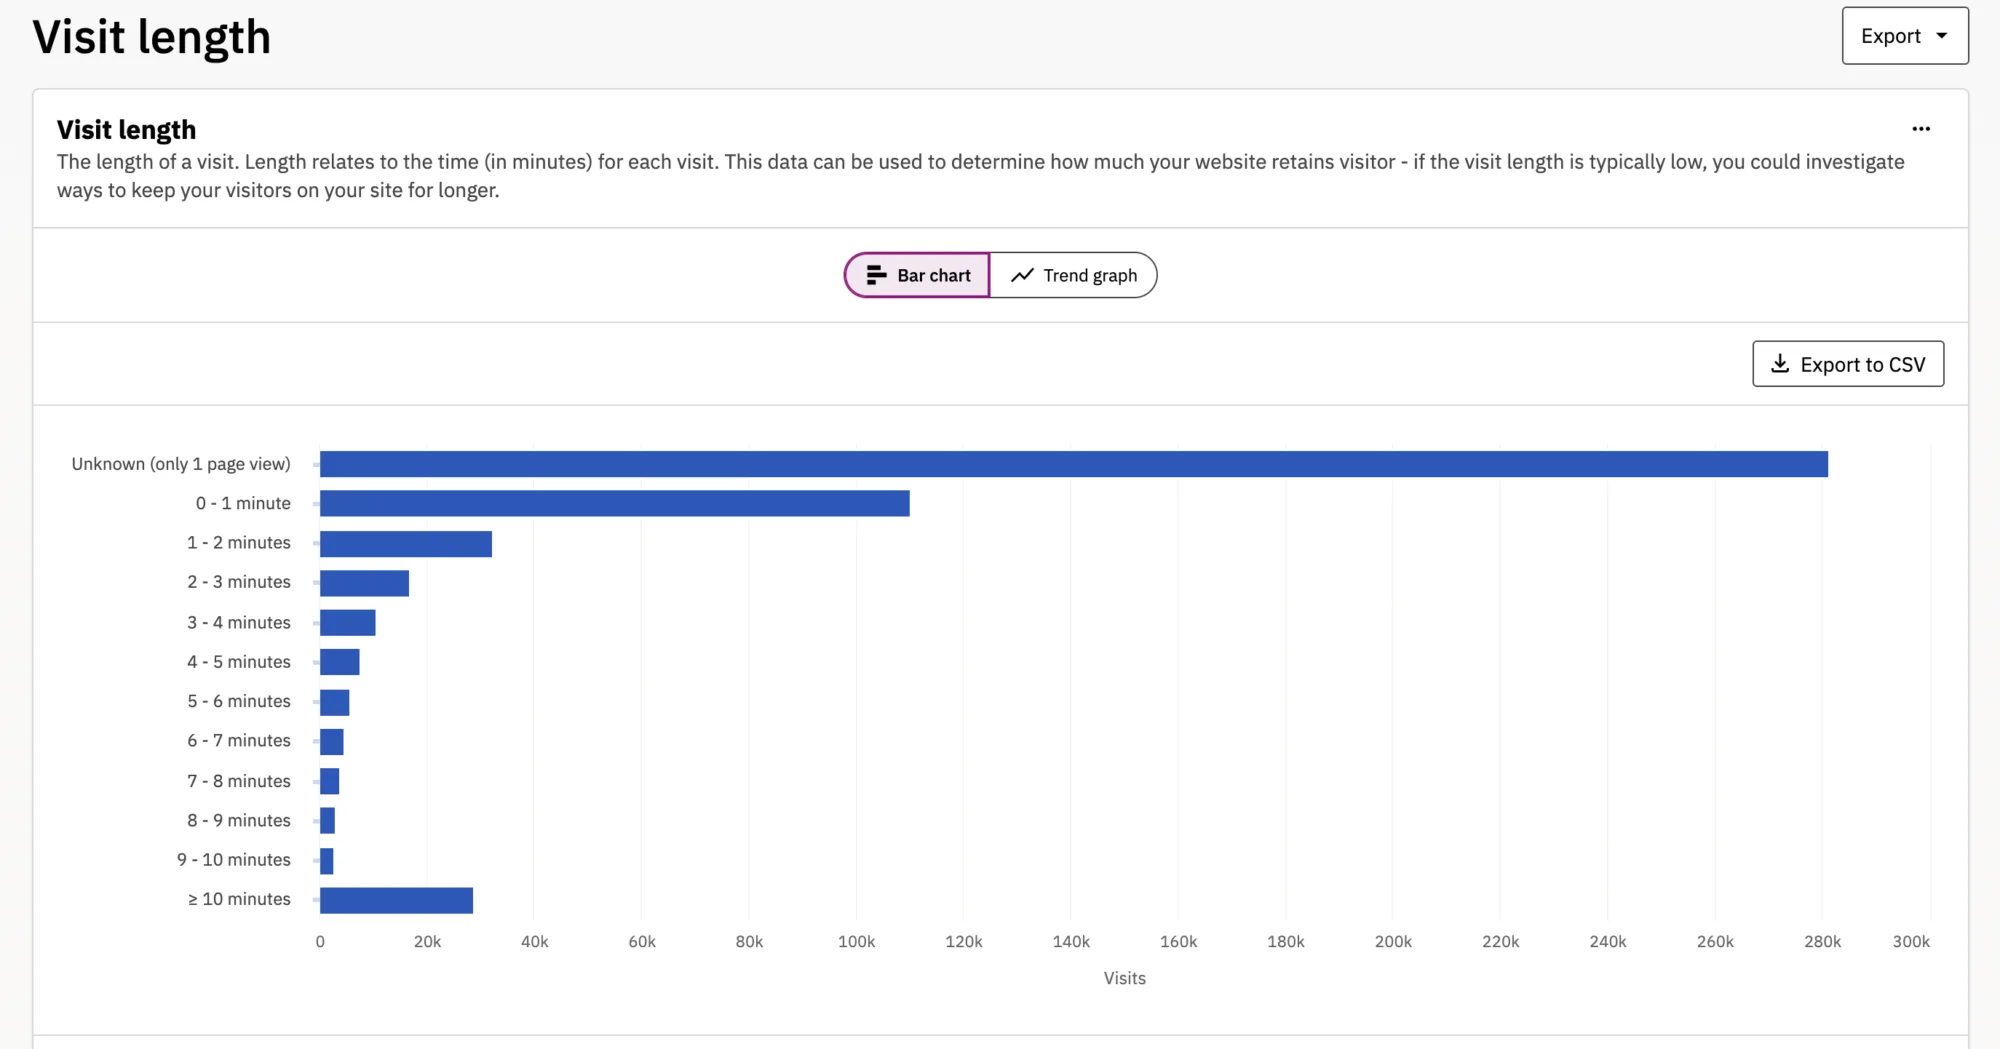
When using Visit Depth and Visit length data alongside navigation depth, this information can provide deeper insight into how users explore your website, how much time they are willing to invest in finding information, and the steps they take before completing an action.
Event Tracking
Like user journeys and Behavior maps, Event Tracking helps you understand how visitors interact with your website. The key difference is that while Behavior maps analyze activity on a single page, event tracking measures interactions across your entire site.
For example, a Behavior map can show which navigation links users click on a specific page. Event Tracking can show which navigation links are clicked most frequently across your entire website, revealing the topics and sections that attract the most interest regardless of where visitors begin their journey.
Siteimprove also automatically tracks interactions with certain elements, such as embedded YouTube videos, allowing you to see how often visitors play and engage with your video content.
Beyond the built-in events, Event Tracking can be customized to measure additional interactions with elements on your website. Whether you want to track button clicks, accordion expansions, or other interactive elements, event tracking provides the data needed to better understand how visitors engage with your content.
If you’d to learn more about user journeys and how to configure one or more on your site, let the digital strategy team know by submitting a Siteimprove Support Request Form.
Your Siteimprove Toolbox

Quality Assurance
Discover the steps you can take to create a more effective, engaging, and user-friendly website experience for everyone.

Analytics
A successful content strategy starts with understanding how your website is performing and what your audience is looking for.

Accessibility
Accessibility isn’t just about what happens behind the curtain—it’s about the experience everyone has in front of it.

SEO & Search
Understanding how visitors find your website and what they want is an essential step in developing an effective content strategy.
Online Presentations
Whether you’re planning to attend an upcoming digital strategy presentation or want to revisit a previous session, explore the topics we cover and resources we share.
Digital Strategy
A strong digital strategy serves as the foundation for your website and every aspect of your digital marketing and communications. Here’s what you need to know.
Want to Chat?
We’re here to support your digital strategy efforts. Reach out with questions or schedule a consultation to discuss your website strategy and explore opportunities for improvement.